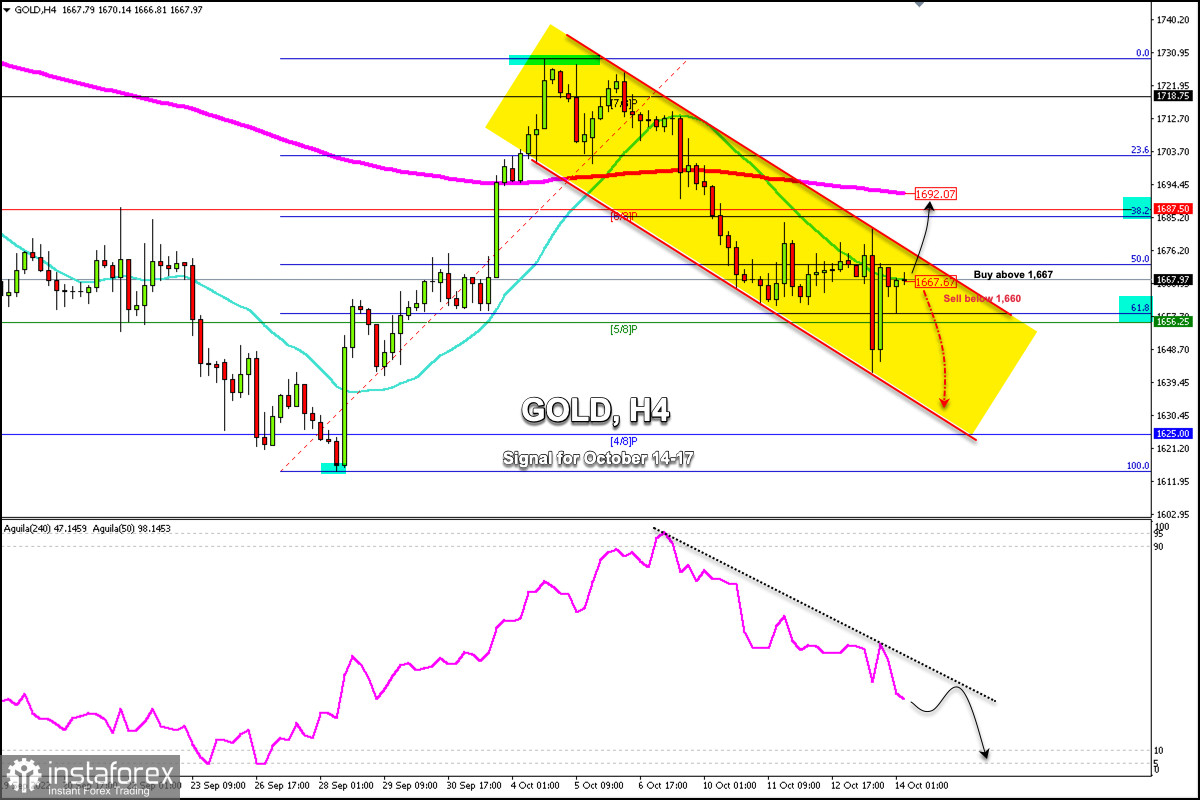
Yesterday, in our daily analysis, a buy signal for XAU/USD at1,642 appeared which was fulfilled, you can check here. Although we believe that gold could have bullish strength but we should expect a sharp break of the downtrend channel and a daily close above 1,670.

Early in the European session, gold (XAU/USD) is trading around 1667 above the 61.8% Fibonacci and inside the downtrend channel formed on the 4-hour chart.
On the 4-hour chart, we can see that gold made a technical bounce from the level of the bottom of the downtrend channel (1,642) and reached the resistance zone of the 21 SMA (1,667).
If it consolidates above 1,667 in the next few hours, gold may continue to rise. It could reach 38.2% Fibonacci (1,685) and even the 200 EMA located at 1,692.
Alternatively, after a daily close below 1,660, we could expect the bearish cycle to resume. It could reach 1,656 (5/8 Murray) and could even drop towards the 4/8 Murray area around 1,630 – 1,625 (4/8 Murray).
A daily close above the psychological level of 1,700 could mean a sustained bullish cycle and this could reach the 8/8 Murray level around 1,750.
The eagle indicator since October 6 is giving a bearish signal. Any technical bounce while gold trades below the 200 EMA is likely to be seen as an opportunity to sell with targets at 1,625.
 English
 Русский
 Bahasa Indonesia
 Bahasa Malay
 ไทย
ไทย Español
 Deutsch
 Български
 Français
 Tiếng Việt
 中文
中文 বাংলা
বাংলা हिन्दी
 Čeština
 Українська
 Română

