Crypto Industry News:
Glassnode, in its weekly on-chain analysis report on October 10, states that bitcoin has "remained remarkably stable" in recent weeks compared to traditional asset markets such as forex and stocks. As it added, in the context of interest rate hikes by central banks, rampant inflation and a strong US dollar, bitcoin has unusually low volatility.
The bottom of a bear market is usually a time of slow and steady accumulation by institutions, seasoned investors, and whales.
The report compared two charts: one for the bear market between September 2018 and April 2019, and the downturn period that began in April 2022. Both charts were incredibly similar - each with a clear capitulation.
Glassnode also sees a spike in whales' activity paying out BTC from exchanges, which is also a signal of accumulation as cryptocurrencies are held by large investors outside of trading platforms rather than being prepared for sale. Whale BTC withdrawals from exchanges reached the level of 15.7 thousand. BTC, the largest since June 2022. A whale is defined as an entity that owns over a thousand bitcoins.
Glassnode also used an indicator called the Accumulation Trend Score to determine the "aggregate intensity of balance changes" of active traders over the past 30 days. The measure "indicates that there has been significant accumulation by large entities". This is another similarity to 2019.
Technical Market Outlook:
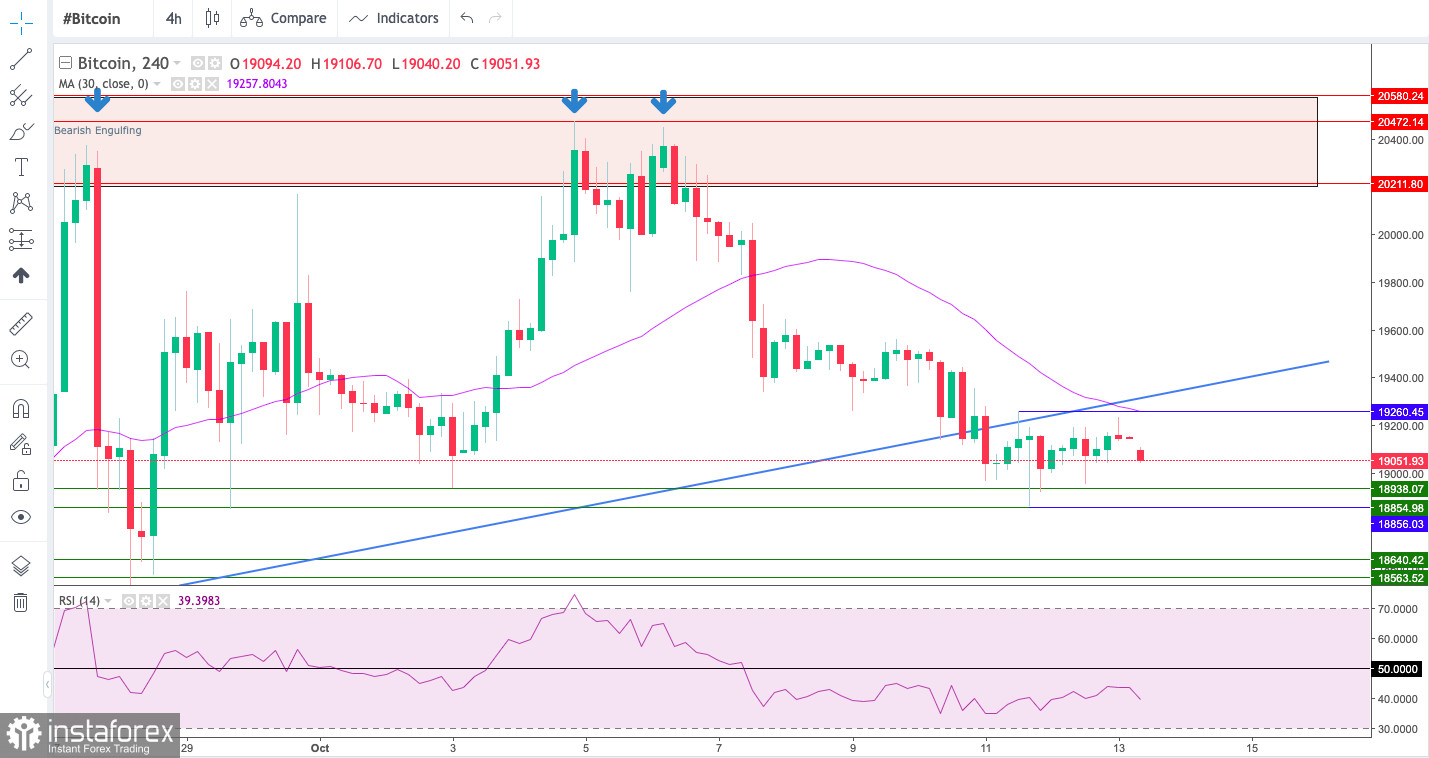
The BTC/USD pair had been seen consolidating around the technical support located at the level of $18,860 however it might be violated soon. The supply zone (marked as a red rectangle) is very important for bulls from a technical point of view, because only a sustained breakout above the levels of $20,221 - $20,580 would change the outlook to more bullish, so please keep an eye on this zone for a possible breakout towards the next target seen at $22,410. The market conditions on the H4 time frame are weak and negative, so a local pull-back towards the short-term trend line support (marked in blue) might happen soon. The nearest technical support is seen at $18,944 and $18,856. The swing low is seen at the level of $18,150.

Weekly Pivot Points:
WR3 - $19,705
WR2 - $19,556
WR1 - $19,482
Weekly Pivot - $19,332
WS1 - $19,257
WS2 - $19,132
WS3 - $19,009
Trading Outlook:
The down trend on the H4, Daily and Weekly time frames continues without any indication of a possible trend termination or reversal. So far every bounce and attempt to rally is being used to sell Bitcoin for a better price by the market participants, so the bearish pressure is still high. The key long term technical support at the psychological level of $20,000 had been violated, the new swing low was made at $17,600 and if this level is violated, then the next long-term target for bulls is seen at $13,712. On the other hand, the gamechanging level for bulls is located at $25,367 and it must be clearly violated for a valid breakout.
 English
 Русский
 Bahasa Indonesia
 Bahasa Malay
 ไทย
ไทย Español
 Deutsch
 Български
 Français
 Tiếng Việt
 中文
中文 বাংলা
বাংলা हिन्दी
 Čeština
 Українська
 Română

