EUR/USD 5M

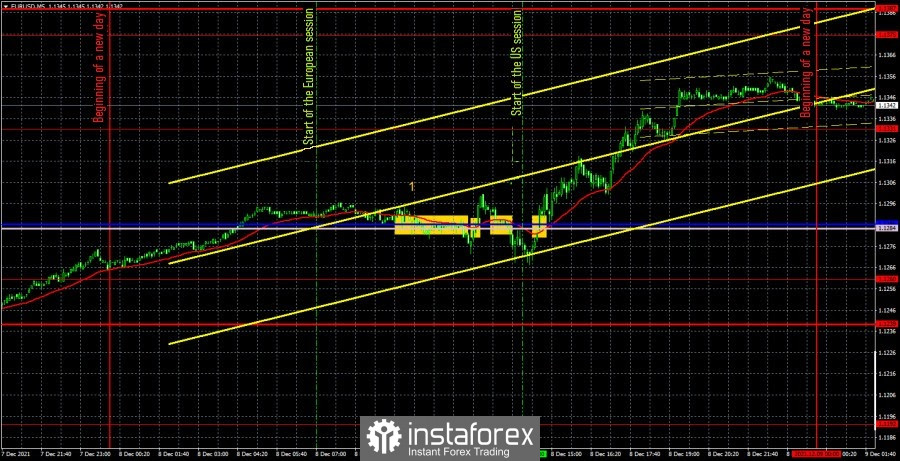
The EUR/USD pair was trading in a flat flat for half a day on Wednesday, and in an upward trend for half a day. Moreover, it is very difficult to say what caused the upward movement in the US trading session, since not a single important macroeconomic event was planned for yesterday in America. The picture was the opposite in the European trading session. There was a speech by European Central Bank President Christine Lagarde and Vice President Luis de Guindos, but the markets did not react in any way to these events. The movement was recorded 25 points up at the very end of the European session, and then down by the same amount. This was probably the market's reaction to the words of de Guindos that inflation could remain high for longer than the ECB expected. However, the markets have been familiar with this information for a long time, since the situation is now about the same all over the world. Thus, yesterday's movements were as illogical as possible. The trend was observed when there was no reason for this. On the other hand, it could be the beginning of a new long-term upward trend if the markets deliberately began to cut dollar positions. All that remains for us is to analyze all the trading signals and understand how one should trade on Wednesday. Unfortunately, the trades were extremely unsuccessful due to the flat in the European session. The price crossed the Senkou Span B and Kijun-sen lines several times, which were located very close to each other, and never once reached the closest target level. The first sell signal was false, and the price could not go down even 10 points and settled above the two lines of the Ichimoku indicator. Again, it could not go up even 10 points, turned down and settled below the Senkou Span B and Kijun-sen lines. Once again, it failed to pass even 10 points after the formation of a sell signal and turned up again, forming a buy signal. Only the last buy signal was not false and it could be worked out. However, after at least three false signals were formed near the Senkou Span B and Kijun-sen lines, the last signal should not have been worked out. Also, the second signal (to buy) should not have been worked out, since it was formed after a rather sharp upward movement. But the first signal should have been worked out, and it brought 17 points of loss. The third signal (to sell) should not have been worked out, since two signals had already turned out to be false by that time.
EUR/USD 1H

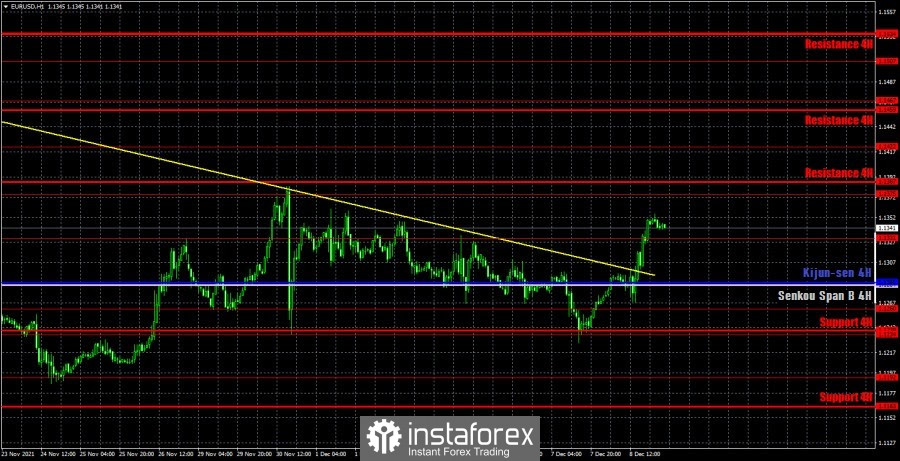
On the hourly timeframe, the pair unexpectedly (due to the practically absent fundamental background) settled above the downtrend line and thus broke the downward trend. Now it is more preferable to buy the euro and I want to believe that this overcoming was not false and not temporary, as it happened earlier due to the practically absent demand for the euro. We highlight the following levels for trading on Thursday - 1.1192, 1.1234, 1.1260, 1.1331, 1.1375, as well as the Senkou Span B (1.1284) and Kijun-sen (1.1286) lines. The Ichimoku indicator lines can change their position during the day, which should be taken into account when looking for trading signals. Signals can be rebounds or breakthroughs of these levels and lines. Do not forget about placing a Stop Loss order at breakeven if the price moves 15 points in the right direction. This will protect you against possible losses if the signal turns out to be false. No important event or publication planned either in the United States or in the European Union on December 9. The only report of the day that you can pay attention to purely for show will be applications for unemployment benefits. However, the probability that it will provoke a reaction from traders is no more than 5%. At the same time, the movement today can be quite volatile and trending, as the markets could set a course for the formation of a new upward trend.
We recommend you to familiarize yourself:
Overview of the EUR/USD pair. December 9. ECB Vice President: High inflation will persist longer than expected.
Overview of the GBP/USD pair. December 9. The House of Representatives approved an increase in the US national debt limit. The next step is the Senate.
Forecast and trading signals for GBP/USD for December 9. Detailed analysis of the movement of the pair and trade deals.
Analysis of the COT report

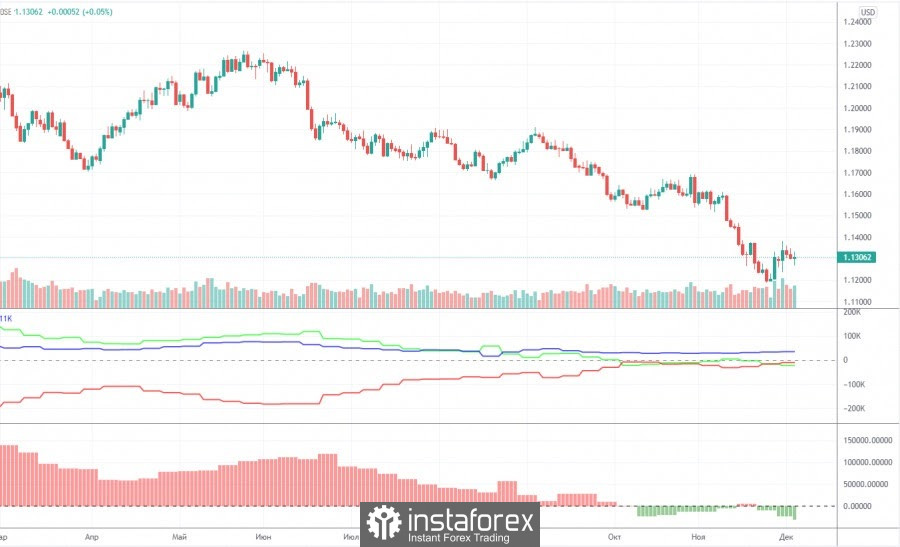
The mood of non-commercial traders became more bearish again during the last reporting week (November 23-29). Judging by the indicators in the chart above, the changes are not so big anymore, but still most professional traders continue to either increase shorts or reduce longs. The non-commercial group closed 15,000 Buy contracts (longs) and 8,500 Sell contracts (shorts) during the reporting week. Thus, their net position decreased by 6,500 contracts. Indeed, a little. The green line of the first indicator has been near the zero level for a long time. And this, by and large, means that the number of open longs and shorts for non-commercial traders is approximately the same. And this, in turn, means that the mood is now more neutral than bearish. But still, almost every week there is an increase in this "weak bearish mood", so now we can conclude that the European currency has excellent chances to continue falling. We just want to remind you about the factor of the market working out the reasons that could bring the dollar so high against the euro. From our point of view, the US currency as a whole continues to grow due to the fact that the probability of tightening the monetary policy of the Federal Reserve is much higher than the probability of tightening the monetary policy of the ECB. Especially now, when EU countries are beginning to close for quarantine and break anti-records on morbidity. However, the dollar has been growing for a very long time, and the Fed, in fact, has only reduced the QE program by $15 billion and that's it. Thus, the factor of a high probability of tightening the Fed's monetary policy has been worked out several times for a long time.
Explanations for the chart:
Support and Resistance Levels are the levels that serve as targets when buying or selling the pair. You can place Take Profit near these levels.
Kijun-sen and Senkou Span B lines are lines of the Ichimoku indicator transferred to the hourly timeframe from the 4-hour one.
Support and resistance areas are areas from which the price has repeatedly rebounded off.
Yellow lines are trend lines, trend channels and any other technical patterns.
Indicator 1 on the COT charts is the size of the net position of each category of traders.
Indicator 2 on the COT charts is the size of the net position for the non-commercial group.
 English
 Русский
 Bahasa Indonesia
 Bahasa Malay
 ไทย
ไทย Español
 Deutsch
 Български
 Français
 Tiếng Việt
 中文
中文 বাংলা
বাংলা हिन्दी
 Čeština
 Українська
 Română

