GBP/USD Breakout Attempt!
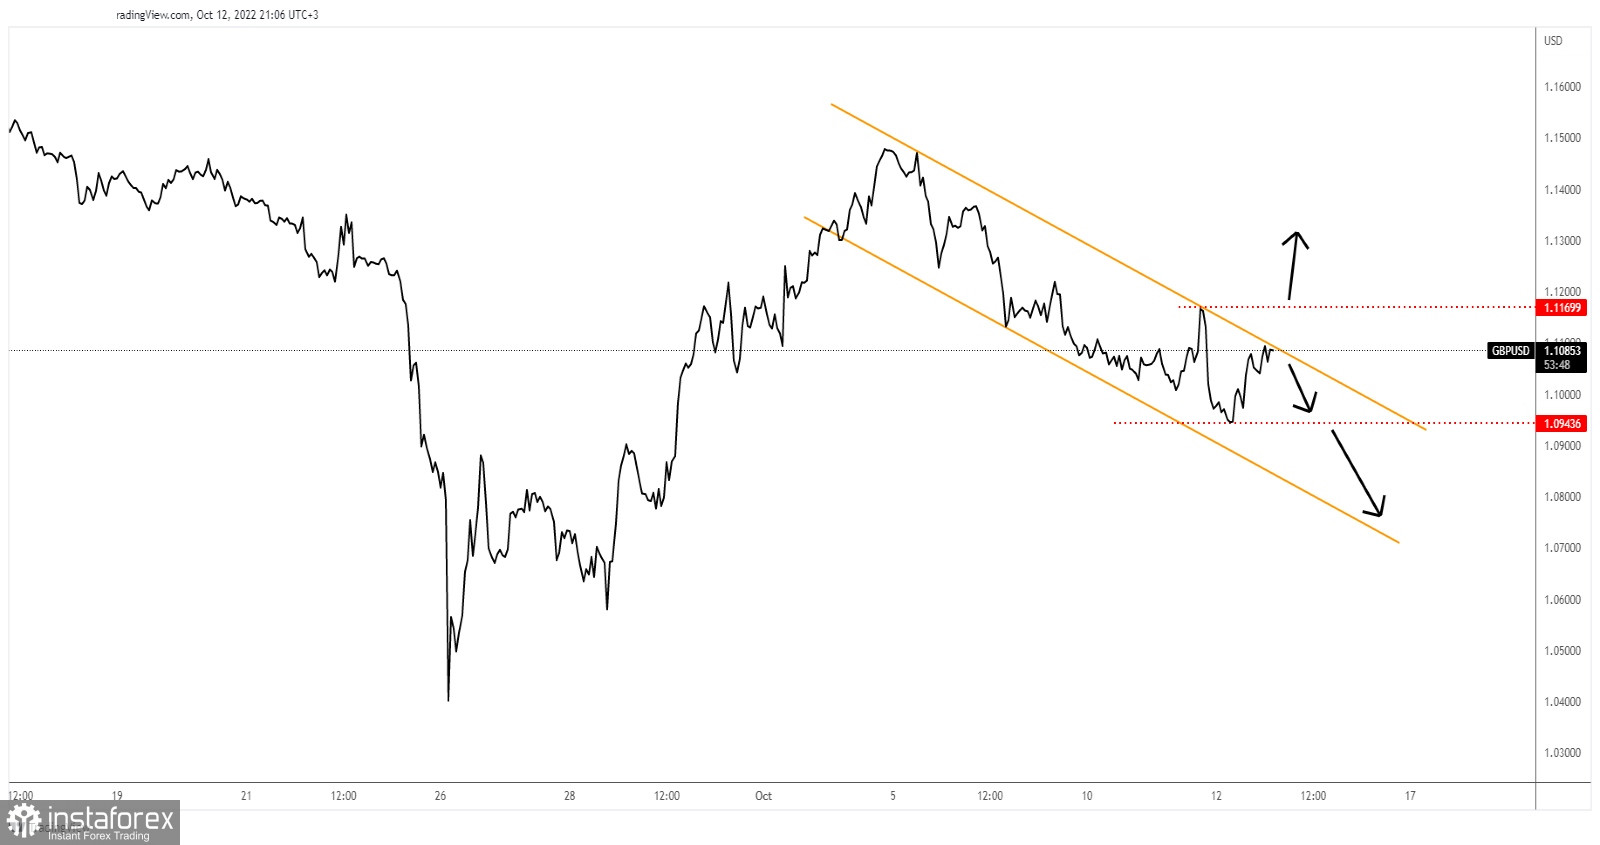
The GBP/USD pair was trading at 1.1097 at the time of writing. As you can see on the H1 chart, the rate dropped within a down-channel pattern. As long as it stays under the downtrend line, the price could resume its downside movement.
The downtrend line represents dynamic resistance. In the short term, it's trapped between the 1.0943 former low, which represents a downside obstacle, and the 1.1169 former high which represents an upside obstacle.
GBP/USD Trading Conclusion!
Staying below the downtrend line and dropping under 1.0943 could activate more declines and could bring new selling opportunities.
Jumping and stabilizing above the downtrend line may signal that the downside movement ended and that the rate could turn to the upside. Passing above 1.1169 could bring new buying opportunities.
 English
 Русский
 Bahasa Indonesia
 Bahasa Malay
 ไทย
ไทย Español
 Deutsch
 Български
 Français
 Tiếng Việt
 中文
中文 বাংলা
বাংলা हिन्दी
 Čeština
 Українська
 Română

