Technical outlook:
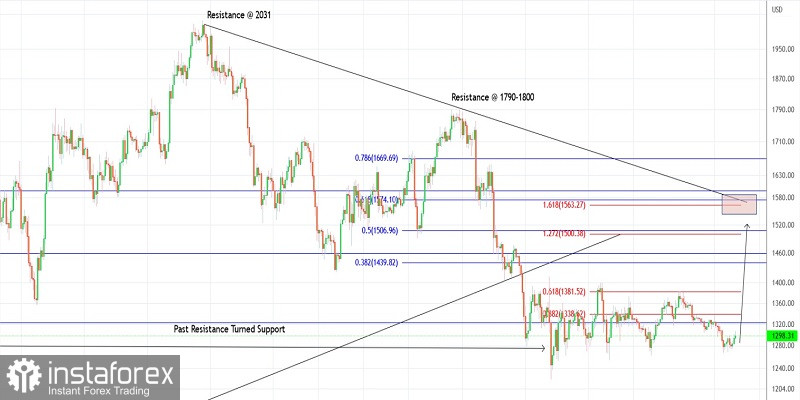
Ethereum has been drifting sideways since printing the $1,220 lows on September 21, 2022, as seen on the 4H chart here. The 100-point trading range between $1,270-80 and $1,380 should be taken out for a breakout to be confirmed. The crypto is seen to be trading close to $1,300 at this point in writing as the bulls prepare to push towards the upper border close to $1,380.
Ethereum has dropped in a bearish cycle between $2,031 and $1,220 as seen on the chart here. Immediate price resistance is seen in the $1,790-1,800 area followed by $2,031, while support comes in around $1,220 levels respectively. With the overall downtrend, prices could retrace at least towards $1,580 before turning again.
Ethereum is working on its current downswing between $1,790-1,800 and $1,220 levels as projected here. The Fibonacci 0.618 retracement is seen passing through $1,580, which is a highly probable resistance zone. A break above $1,380 will push prices through $1,580 before reversing lower again towards $1,000 and further.
Trading idea:
Potential short-term rally towards $1,580 at least against $1,050
Good luck!
 English
 Русский
 Bahasa Indonesia
 Bahasa Malay
 ไทย
ไทย Español
 Deutsch
 Български
 Français
 Tiếng Việt
 中文
中文 বাংলা
বাংলা हिन्दी
 Čeština
 Українська
 Română

