Wave pattern
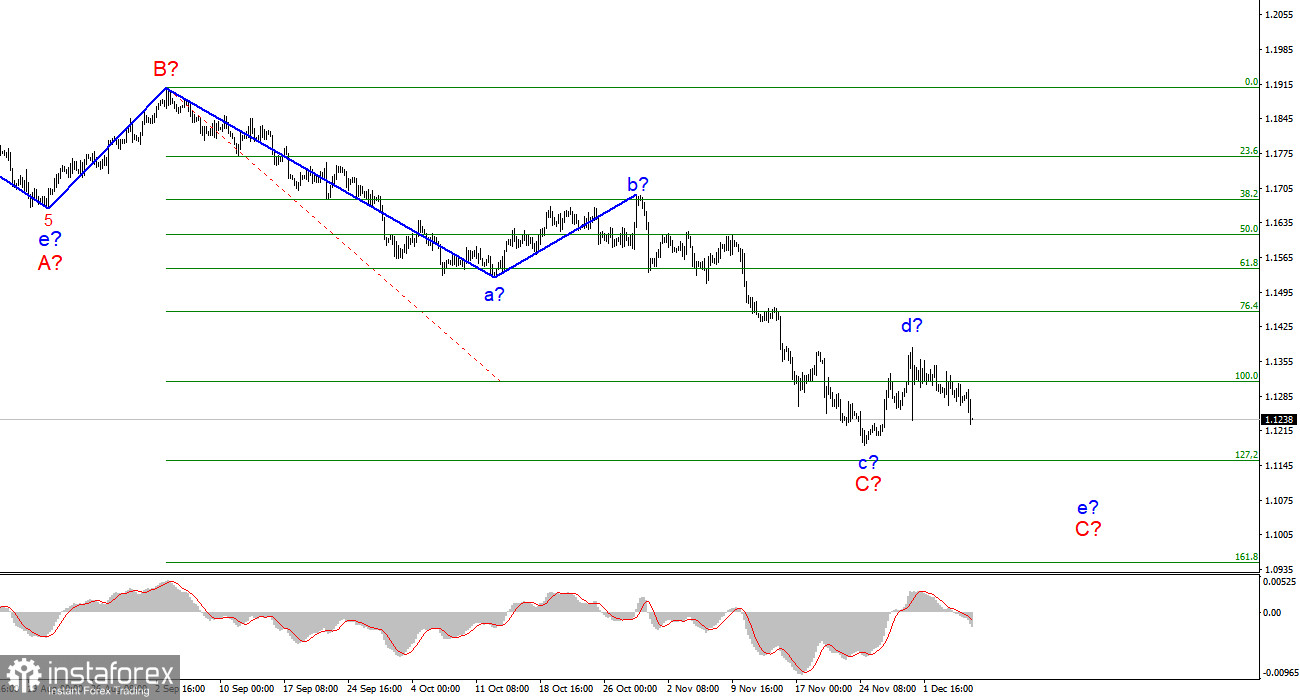
The wave layout for EUR/USD on the 4-hour chart remains complete and does not require any changes. The a-b-c-d-e section of the trend, which was formed at the very beginning of the year, should be interpreted as a wave A, and the subsequent rise in the instrument is seen as a wave B. Thus, the formation of the assumed wave C continues and can take a very extended form. At the same time, we can assume that the formation of the new ascending wave has been completed, presumably, the wave d in C. If the current layout is correct, the C wave may take a five-wave corrective structure. Therefore, I expect to see another descending wave e in C. A successful attempt to break through the 100.0% Fibonacci level will indicate that the market is ready to go short on the instrument. So, the d wave may soon be completed. The pair may continue to fall throughout the week towards the estimated target of 1.1152 which corresponds to the 127.2% Fibonacci retracement where the entire trend section can complete its formation. I also would like to highlight that the C wave is still taking on a corrective form. So, the entire descending section of the trend, which originated in January 2021, may take a five-wave form of A-B-C-D-E instead of a three-wave structure.
Danske Bank: Fed will with its bond-buying taper
The news background for the EUR/USD pair on Monday and Tuesday was not strong. By and large, there was only one report in both the EU and the US that could move the markets. But it seems that neither of the two reports had caused any reaction among market players. GDP in the eurozone in the third quarter came in at 2.2%. This reading came in line with market expectations. Moreover, this value was exactly the same a month ago, so nothing unexpected happened. In the US, the data on the foreign trade balance came out. It was hardly surprising that it turned out to be negative and amounted to -$67.1 billion in October. This is exactly the same amount as in the forecast. Thus, the second report did not generate any reaction either. At the same time, analysts at Danske Bank concluded that after Jerome Powell's statements last week, the Fed will decide to increase the pace of cutting the quantitative stimulus program to $25 billion a month. However, this will not happen until January 2022. The Fed will completely stop buying assets in April 2022. Also, the bank's analysts shared their forecasts regarding the rate hike next year. In their opinion, this will happen three times: in June, September, and December. Another 4 rate hikes are due in 2023. The bank believes that the rate of stimulus curtailment can be accelerated to $30 billion a month and the interest rate may be raised as soon as March 2022.
Conclusion
Based on the analysis above, I can conclude that the formation of the descending wave C is likely to be completed. However, the internal structure of the assumed wave d suggests that another descending wave e may start to form soon. So, I recommend selling the pair with the targets at 1.1152. The Stop Loss order should be placed above the 100.0% Fibonacci level.

Higher time frame
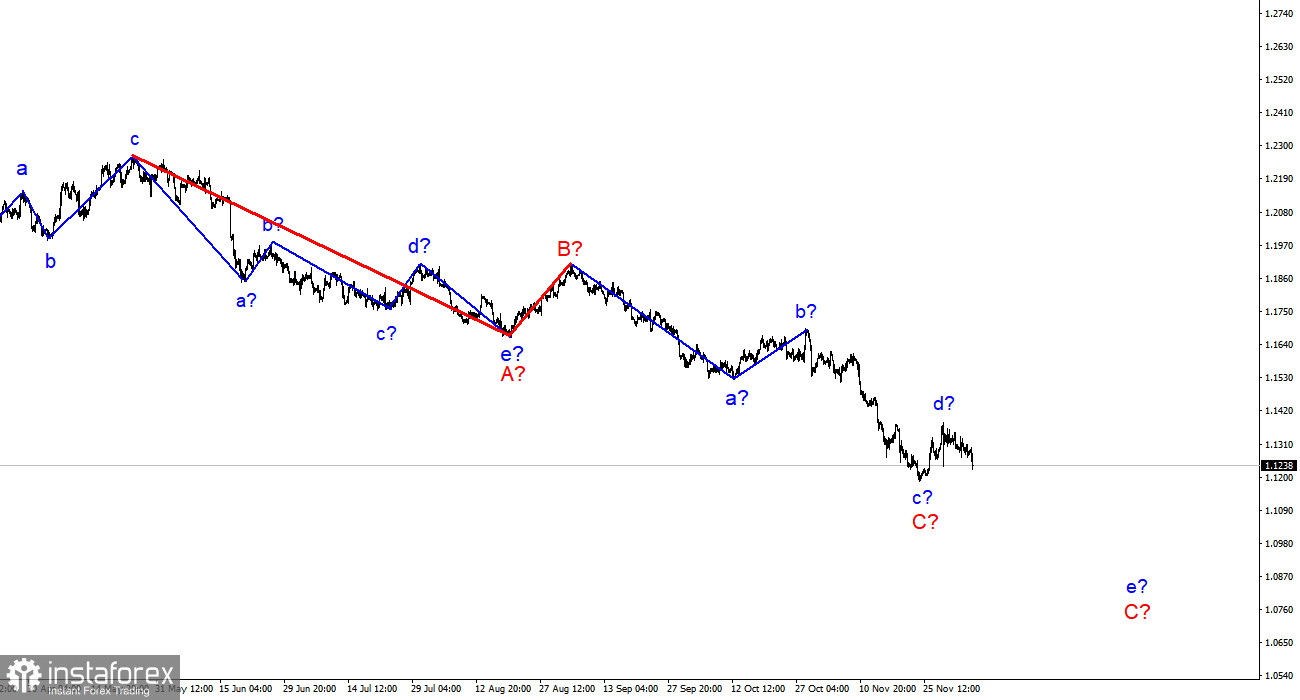
The wave layout on the higher time frame looks quite convincing. The quotes continue to move lower. The descending section of the trend that was initiated on May 25 takes the form of a three-wave correctional pattern A-B-C. This means that the downtrend may continue for several more weeks until the C wave is fully formed. It should take a five-wave structure in this case.
 English
 Русский
 Bahasa Indonesia
 Bahasa Malay
 ไทย
ไทย Español
 Deutsch
 Български
 Français
 Tiếng Việt
 中文
中文 বাংলা
বাংলা हिन्दी
 Čeština
 Українська
 Română

