Today's article on the main Forex currency pair will start with the COVID-19 topic, followed by a look at the economic calendar and at the technical picture of the EUR/USD. In Europe, as elsewhere in the world, a new strain of coronavirus called Omicron is causing growing concern. However, as experts in South Africa have said, the COVID-19 strain is easier to spread among the population and is relatively mild or asymptomatic. Nevertheless, given the seasonal cycle of common flu or acute respiratory viruses, authorities in several European countries have imposed restrictions on tourist entry regulations and tightened the rules for gathering people in closed spaces. In my opinion, this is quite reasonable. It is better to be safe than to let another spike in the number of infections occur.
European Central Bank (ECB) President Christine Lagarde spoke at the end of last week. There were two key themes in the ECB president's speech. They were the economic outlook for the eurozone in light of soaring inflation and the possible restrictions associated with the emergence of Omicron. As for inflation, Lagarde said that the eurozone had already reached its peak and inflation would gradually start to slow down next year. There is no new information on this important issue for markets. As for the economic outlook, it will largely depend on the adoption of restrictive measures related to the coronavirus and the emergence of its next new strain. However, Lagarde admitted that she had no idea how quickly Omicron will spread across the eurozone.
Looking at today's economic calendar, the Economic Sentiment Index from the ZEW institute for Germany and the eurozone, GDP data for the eurozone as well as the US trade balance are worth highlighting. Forecasts and release times for these and other macroeconomic data can easily be found in the economic calendar.
Daily

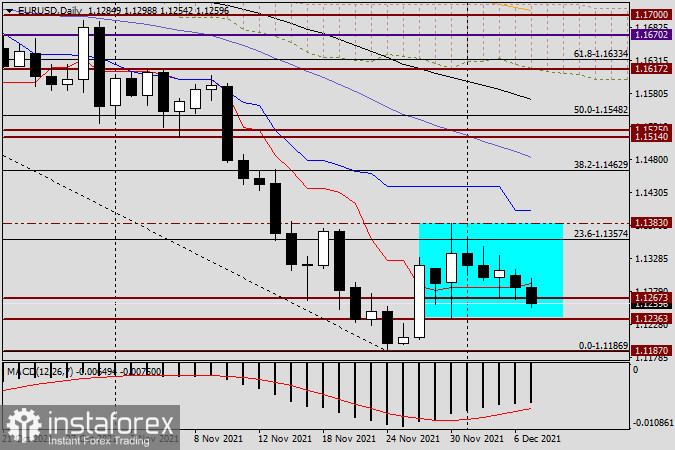
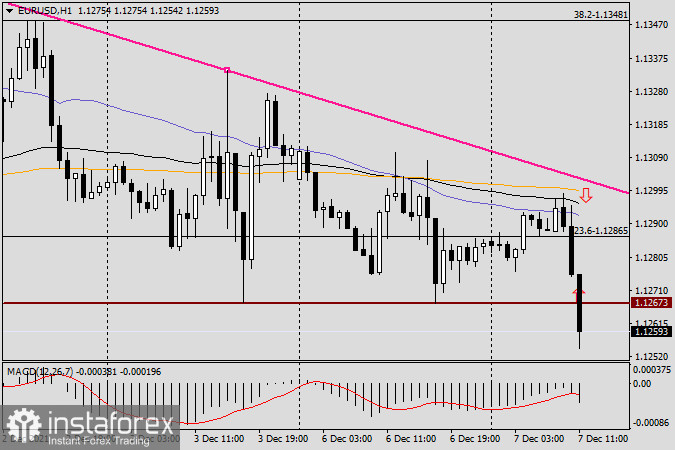
The pair ended yesterday's trading with a slight decline, closing Monday's session slightly below the red Tenkan line of the Ichimoku indicator. However, in my personal opinion, this factor should not be perceived as a clear signal to further decline. Although the possibility should not be ignored. At the same time, it would not be surprised if today's trading ends up higher, with the closing price above the Tenkan. Possibly, until the pair moves out of the marked range in which EUR/USD has been traded since the 20s of last month, guessing about the further direction of the quote is rather difficult.
H1

 English
 Русский
 Bahasa Indonesia
 Bahasa Malay
 ไทย
ไทย Español
 Deutsch
 Български
 Français
 Tiếng Việt
 中文
中文 বাংলা
বাংলা हिन्दी
 Čeština
 Українська
 Română

