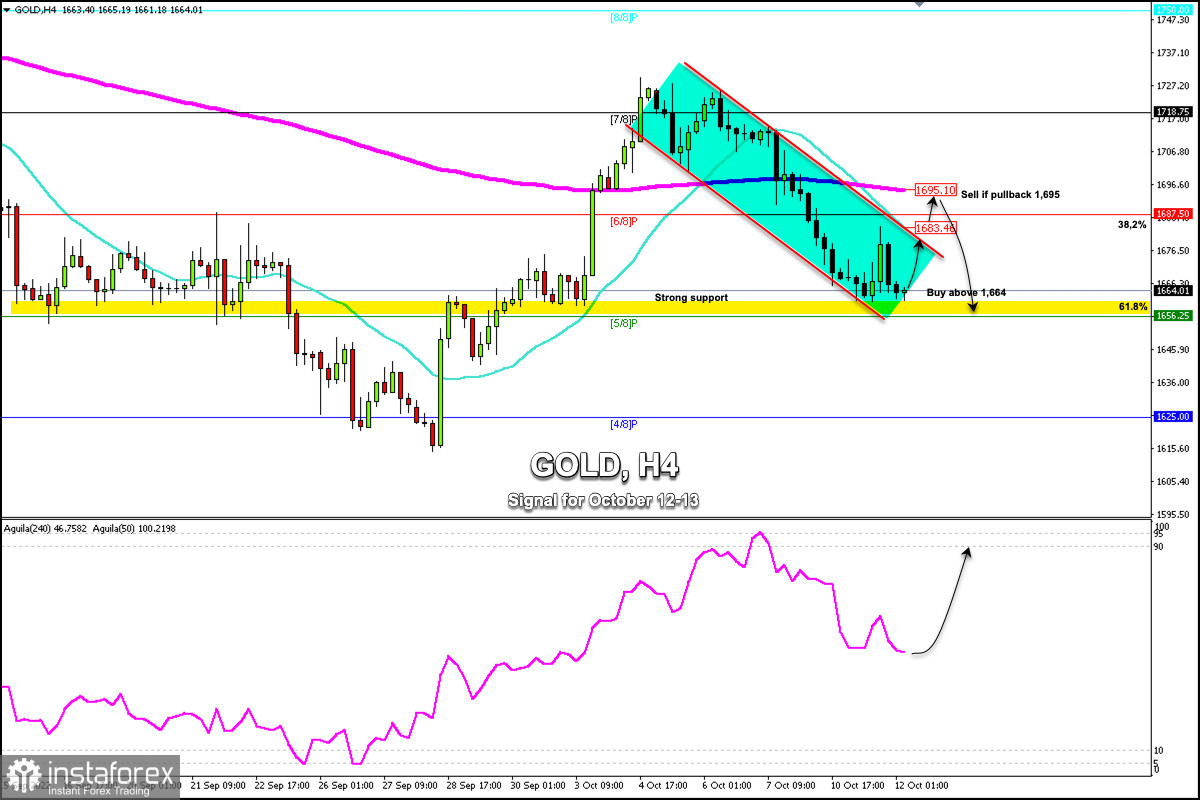
Early in the European session, Gold (XAU/USD) is trading around 1,664 consolidating above support at 1,660. This support could offer traders an opportunity to buy on the technical bounce and gold could eventually reach the top of the downtrend channel around 1,683.
Risk aversion could limit the recovery of XAU/USD in the coming days. Investors are awaiting the release of the FOMC minutes and US inflation data for September which will be released on Wednesday and Thursday, respectively.
On the 4-hour chart, we can see that gold has been trading within a downtrend channel since October 3. The key area of 5/8 Murray could offer immediate support for gold.
In case gold bounces above this level, it could be considered a buying opportunity. Additionally, a sharp break above the 21 SMA and above 6/8 Murray could be a clear signal to buy and the price could reach 1,718 (7/8 Murray) and 1,750 (8/8 Murray).
Conversely, with a sharp break and daily close below 5/8 Murray (1,656), we could expect the bearish bias to resume and gold could drop towards 4/8 Murray at 1,625 (4/8).
The 4-hour chart shows that the asset is consolidating around the 61.8% Fibonacci retracement. This level is measured between the low of 1,615 and the high of 1,729, giving 61.8% around 1,658.
The 38.2% retracement offers immediate resistance at 1,685. This level converges with the top of the downtrend channel and the 21 SMA. If any of these levels are broken, XAU/USD should gain directional strength and could reach 1,695 (200 EMA) and 1,718.
Our trading plan for the next few hours is to buy above 61.8% around 1,656 to 1,664 with targets at 1,683 and 1,695. On the other hand, in case there is a pullback around the 21 SMA or 200 EMA, it will be seen as an opportunity to sell with targets at 1,656.
 English
 Русский
 Bahasa Indonesia
 Bahasa Malay
 ไทย
ไทย Español
 Deutsch
 Български
 Français
 Tiếng Việt
 中文
中文 বাংলা
বাংলা हिन्दी
 Čeština
 Українська
 Română

