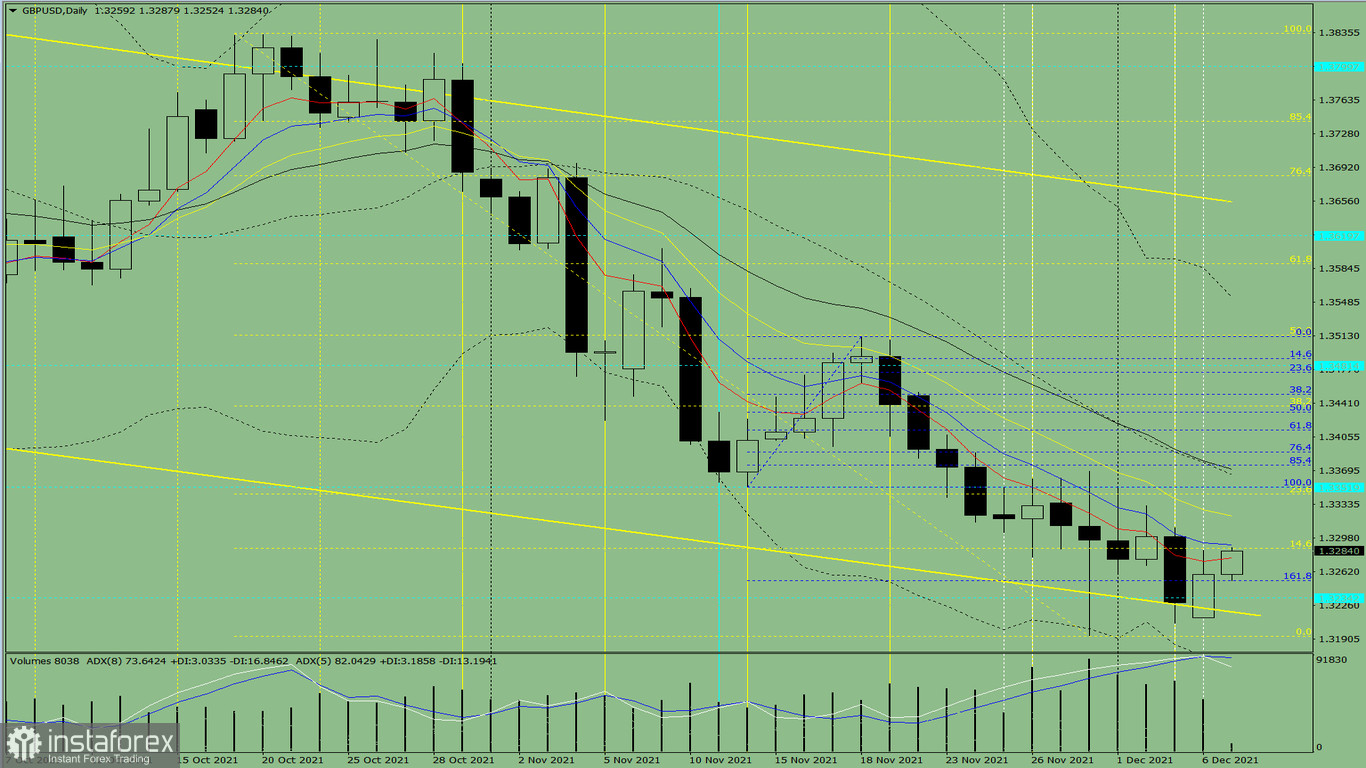
Trend analysis (Fig. 1)
GBP / USD will try to move up this Monday, from 1.3259 (closing of yesterday's daily candle) to the 23.6% retracement level (yellow dashed line) - 1.3344. Then, it will go further up to 1.3371, which is the 21-day EMA (black thin line).

Fig. 1 (daily chart)
Comprehensive analysis:
Indicator analysis - uptrend
Fibonacci levels - uptrend
Volumes - uptrend
Candlestick analysis - uptrend
Trend analysis - uptrend
Bollinger bands - uptrend
Weekly chart - uptrend
Conclusion: GBP/USD will rise from 1.3259 (closing of yesterday's daily candle) to the 23.6% retracement level (yellow dashed line) - 1.3344. Upon reaching it, the quote will continue climbing to 1.3371, which is the 21-day EMA (black thin line).
There is a low chance that GBP/USD will move from 1.3259 (closing of yesterday's daily candle) to the 14.6% retracement level (yellow dashed line) - 1.3287, and then go down to 1.3184, which is the lower fractal (yellow dashed line).
 English
 Русский
 Bahasa Indonesia
 Bahasa Malay
 ไทย
ไทย Español
 Deutsch
 Български
 Français
 Tiếng Việt
 中文
中文 বাংলা
বাংলা हिन्दी
 Čeština
 Українська
 Română

