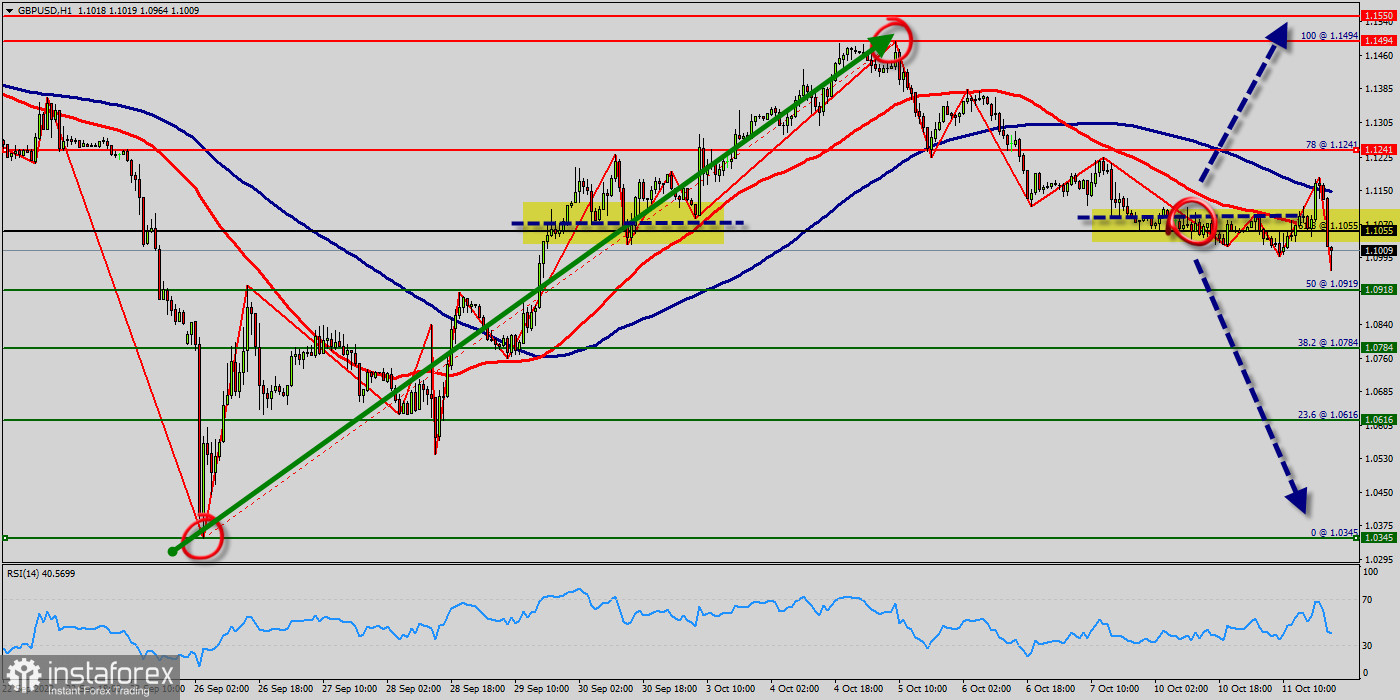
The Pound pair is at an all-time lowest against the dollar around the spot of 1.0345, but the trend rebounded to reach the top of 1.1494. The GBP/USD pair is inside in downward channel. For three weeks GBP/USD pair decreased within a down channel, for that GBP/USD pair hits new lowest 1.1055 and 1.0989.
Consequently, the first support is set at the level of 1.0918. Hence, the market is likely to show signs of a bullish trend around the area of 1.0918 and 1.0900.
If the GBP/USD pair fails to break through the support prices of 1.0918 and 1.0900. today, the market will rise further to 1.1000 so as to try to break it.
The GBP/USD pair is one the best overall investment this week. However, if you want to try to improve the growth of the GBP/USD pair, thus it seems great to buy above the last bearish waves of $1.0918 and 1.0900.
Buy orders are recommended above the major's support rates of (1.0918 and 1.0900) with the first target at the level of 1.1055.
Furthermore, if the trend is able to breakout through the first resistance level of 1.1055.
Furthermore, if the trend is able to breakout through the first resistance level of 1.1055 (1.1055 - to test the 61.8% of Fibonacci retracement levels). We should see the pair climbing towards the next target of 1.1241.
We should see the pair climbing towards the next target of 1.1241 (to test the 78% of Fibonacci retracement levels).
The pair will move upwards continuing the development of the bullish trend to the level 1.1055 - golden ratio 61.8%. It might be noted that the level of 1.1241 is a good place to take profit because it will form a new double top in coming hours.
Uptrend scenario :
An uptrend will start as soon, as the market rises above support level 1.0918, which will be followed by moving up to resistance level 1.1055. Further close above the high end may cause a rally towards 1.1115 and 1.1241. Nonetheless, the weekly resistance level and zone should be considered at 1.1241.
Alternative scenario :
The breakdown of 1.0918 will allow the pair to go further down to the prices of 1.0784 and 1.0714.
 English
 Русский
 Bahasa Indonesia
 Bahasa Malay
 ไทย
ไทย Español
 Deutsch
 Български
 Français
 Tiếng Việt
 中文
中文 বাংলা
বাংলা हिन्दी
 Čeština
 Українська
 Română

