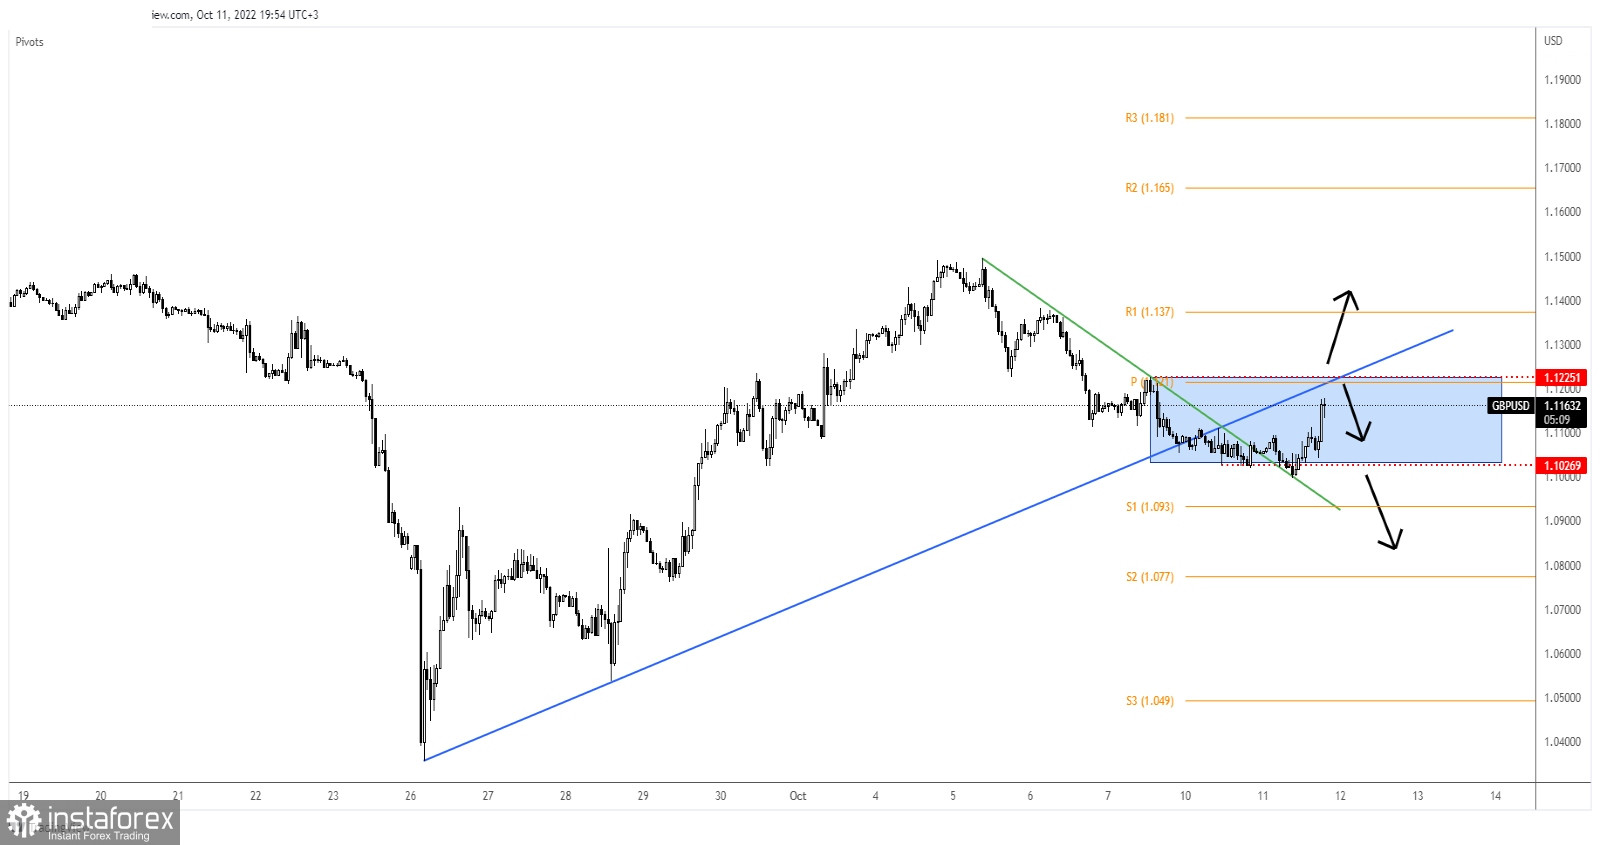
The GBP/USD pair turned to the upside as the DXY crashed in the last hours. After its strong growth, the Dollar Index's drop is natural. The index could test and retest the near-term support levels before coming back higher.
Fundamentally, the UK economic data came in mixed. The Unemployment Rate was reported at 3.5% below the 3.6% expected, Claimant Count Change came in at 25.5K compared to 4.2K expected, while the Average Earnings Index registered a 6.0% growth exceeding the 5.9% expected.
The USD crashed even if the IBD/TIPP Economic Optimism came in at 41.6 points above 40.5 expected, while NFIB Small Business Index was reported at 92.1 points above 91.2 expected. Maybe the USD losses ground versus its rivals ahead of the US inflation data. The CPI and Core CPI data will be released on Thursday. Higher inflation could force the USD to dominate the currency market again.
GBP/USD Range Pattern!

In the short term, it is trapped between 1.1026 and 1.1225 levels. After dropping below the uptrend line, the GBP/USD pair was somehow expected to develop a strong downside movement.
Still, the rate failed to stay under the minor downtrend line or to stabilize below 1.1026 signaling exhausted sellers. Now, is almost to reach the 1.1210 pivot point, the 1.1225 former high, and the uptrend line. These represent upside obstacles.
GBP/USD Prediction!
A valid breakout above the 1.1225 and through the uptrend line may signal further growth. This scenario brings long opportunities with a potential target at the 1.1495 high.
False breakouts through the resistance levels may signal a new sell-off at least towards 1.1026. A new lower low activates more declines and brings short opportunities.
 English
 Русский
 Bahasa Indonesia
 Bahasa Malay
 ไทย
ไทย Español
 Deutsch
 Български
 Français
 Tiếng Việt
 中文
中文 বাংলা
বাংলা हिन्दी
 Čeština
 Українська
 Română

