EUR/USD M5 Chart Analysis

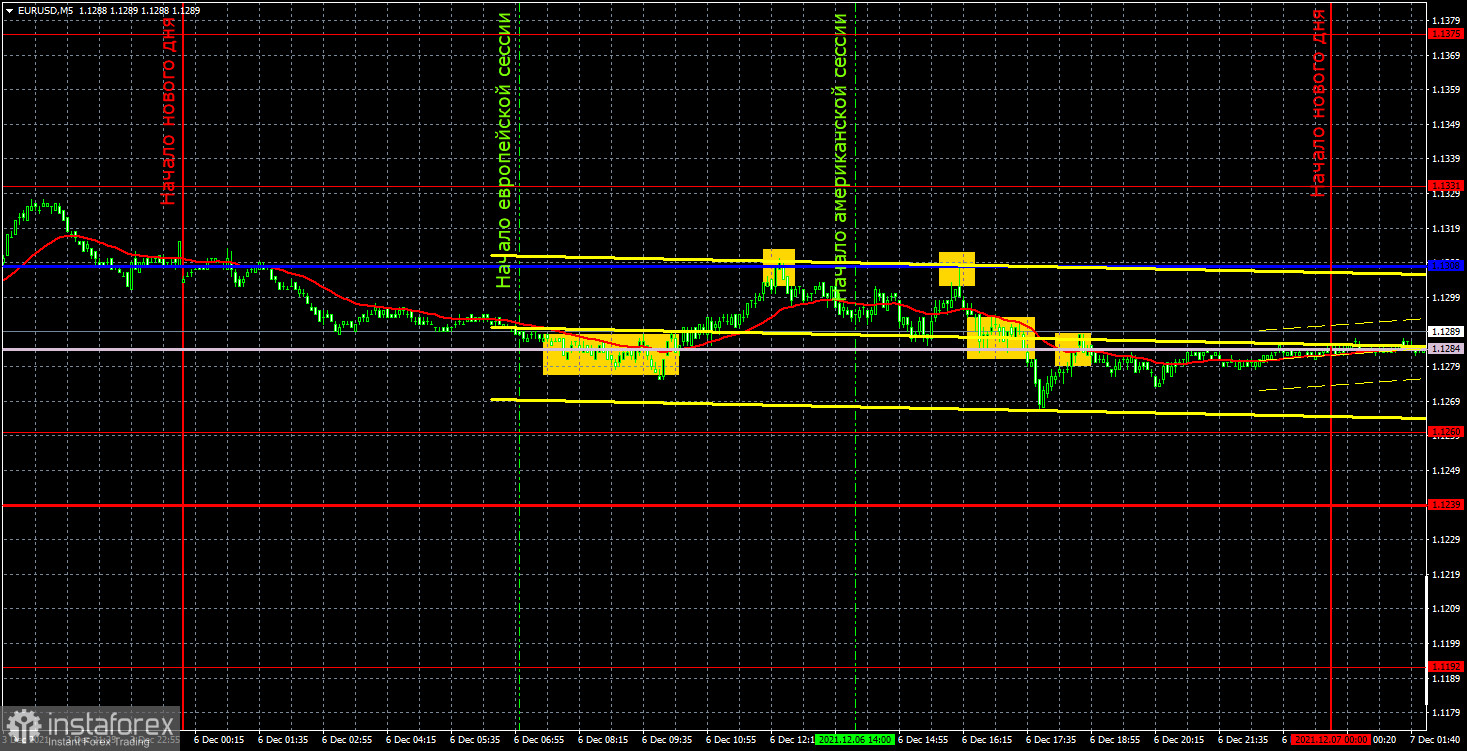
The EUR/USD pair spent the first trading day of the week moving with low volatility. Although the price tested the Ichimoku indicator lines several times, trading activity was rather thin. On Monday, market volatility was just over 40 pips. Therefore, it was impossible to count on a large number of profitable signals as well as strong momentum. The point is that yesterday's macroeconomic calendar was bereft of any important fundamental events from both the United States and the European Union. Thus, traders had nothing to react to during the day, except technical signals. So let's get down to their analysis. First, a buy signal appeared near the Senkou Span B line. It was weak and formed several hours before the pair consolidated above that line. Therefore, traders opened long positions. Then the price tested the nearest target in the form of the Kijun-sen line and rebounded, thus creating a sell signal. This signal indicated the opportunity to close long positions in profit of about 10 pips and open short ones. In the American trading session, the pair returned to the Kijun-sen line and then bounced off it again, forming another sell signal. New short positions generated about 22 pips in profit as the price crossed the Senkou Span B line, and the trade should have been closed manually in the late session.
EUR/USD H1 Chart Analysis

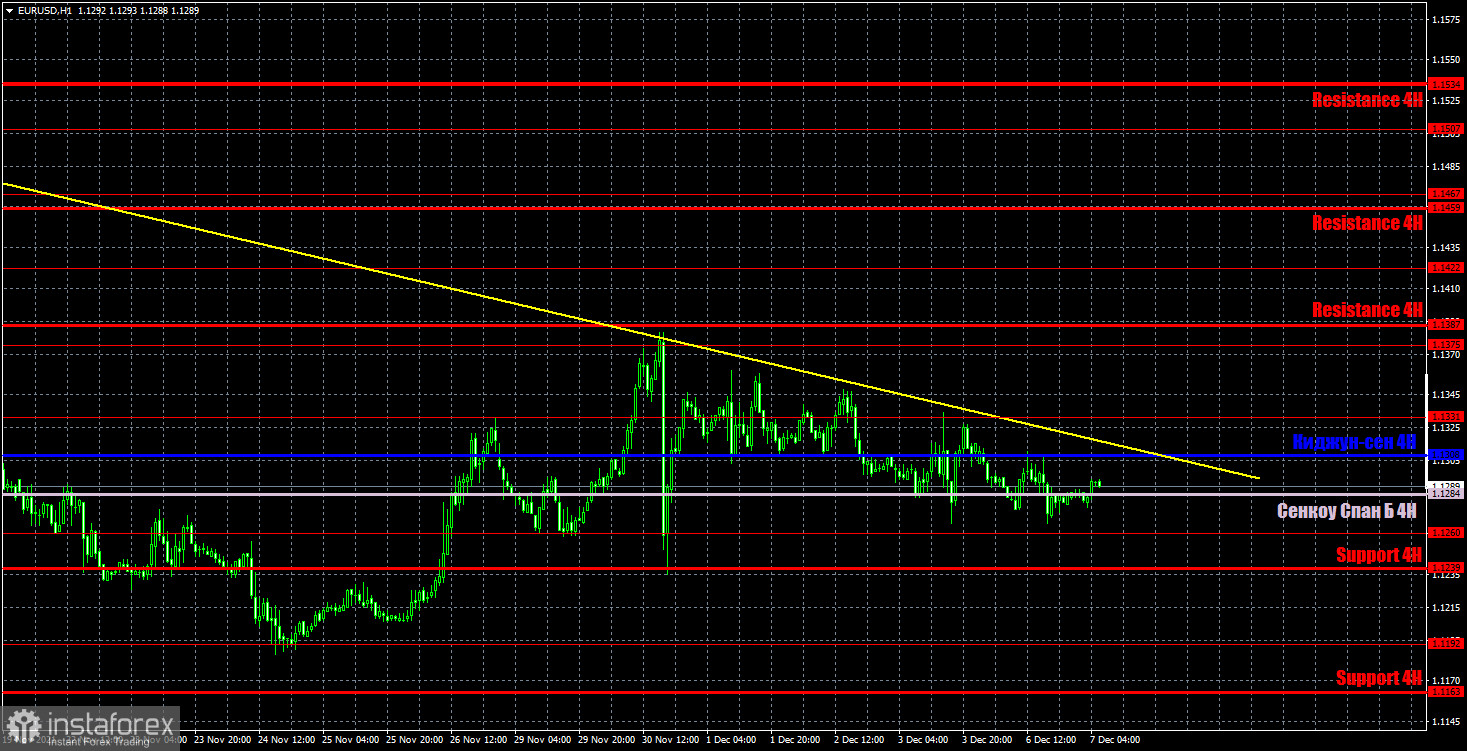
On the hourly chart, the pair continues trading below the down trendline, so the trend remains bearish. Since the pair has once again fixed below the Senkou Span B line, the European currency has every chance of losing ground. However, the trendline is now very close to the price, so bulls may well make another attempt to break the downtrend at any moment. On Tuesday, it is worth focusing on the following levels - 1.1192, 1.1260, 1.1331, 1.1375, 1.1422, as well as the Senkou Span B (1.1284) and Kijun-sen (1.1308) lines. The Ichimoku indicator lines may shift during the day, which should be taken into account when looking for trading signals. Signals can be "bounces" and "breakouts" of these levels and lines. Do not forget about moving a Stop Loss order to breakeven if the price passes 15 pips in the right direction. This will protect you from suffering losses in case a signal turns out to be false. On December 7, the euro area will report data on its third estimate of third-quarter GDP as well as Germany will publish the ZEW research institute's economic sentiment index. However, these reports are of secondary importance and are unlikely to provoke strong reaction from traders. Besides, today's macroeconomic calendar is bereft of any important releases from the United States.
Traders are recommended to read the following articles:
Forex Analysis & Reviews: Fundamental analysis of EUR/USD for December 7, 2021.
Forex Analysis & Reviews: Fundamental analysis of GBP/USD for December 7, 2021
COT Report

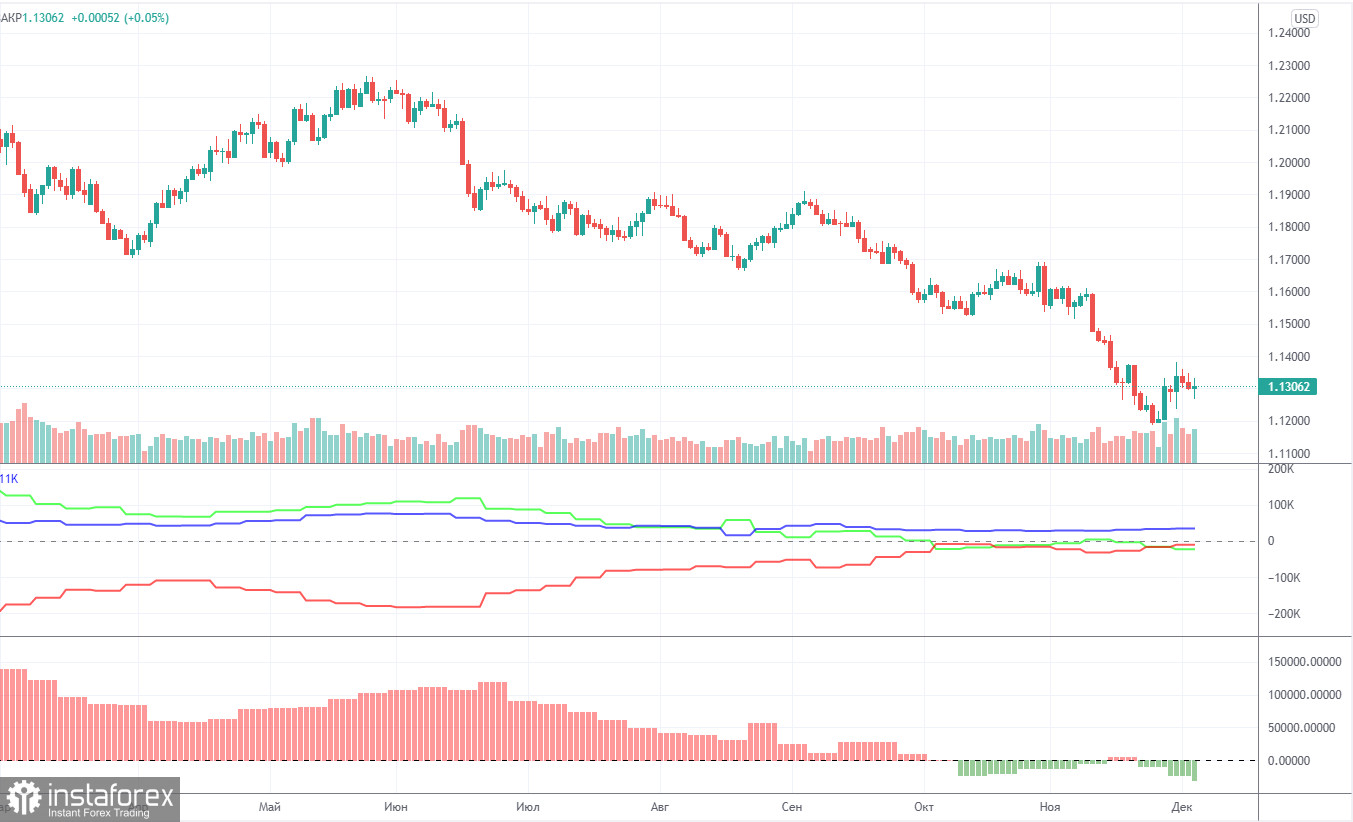
The last reporting week (November 23-29) showed that sentiment of non-commercial traders became more bearish again. According to the above chart, there have been no drastic changes. Most professional traders continue to either open short positions or close long ones. During the reporting week, non-commercial traders closed 15,000 buy contracts and 8,500 sell contracts. Thus, their net position decreased by 6,500 contracts. The green line of the first indicator has been near zero for a long time. This means that the number of open long and short positions opened by non-commercial traders is approximately the same. This, in turn, indicates that market sentiment is now more neutral than bearish. Nevertheless, the volume of short positions increases almost every week. Therefore, the European currency will most likely continue trading downwards. In our opinion, the US dollar is gaining due to the fact that the likelihood of the Fed's monetary policy tightening is much higher than the likelihood of a monetary policy tightening by the ECB. Especially when the EU countries are beginning to impose quarantine restrictions, setting anti-records for coronavirus cases. However, the greenback has been strengthening for a very long time, while the Fed has just reduced the QE program by $15 billion so far. Thus, the factor indicating the likelihood of the Fed's monetary policy tightening has already been worked out.
Explanations for charts:
The levels of support and resistance (resistance / support) are levels that are targets when opening long or short positions. You can place Take Profit orders near them.
The Kijun-sen and Senkou Span B lines are the Ichimoku indicator lines that have been moved to the 1-hour chart from the 4-hour chart.
Support and resistance areas are areas from which the price has repeatedly bounced off.
Yellow lines are trendlines, trend channels, and any other technical patterns.
Indicator 1 on the COT chart is the net position of each category of traders.
Indicator 2 on the COT chart is the net position for the "non-commercial" group.
 English
 Русский
 Bahasa Indonesia
 Bahasa Malay
 ไทย
ไทย Español
 Deutsch
 Български
 Français
 Tiếng Việt
 中文
中文 বাংলা
বাংলা हिन्दी
 Čeština
 Українська
 Română

