Hi, dear traders!
The main event of last week's economic calendar was the US non-farm payroll report. According to data released by the US Department of Labor on Friday, unemployment reached 4.2% in November. 210,000 new jobs were created in the US economy. Economists forecasted an unemployment rate of 4.5% and 550,000 new jobs created. The disbalance between unemployment and job growth should make Fed officials reconsider their statements about the excellent recovery of the US labor market.
The UK has tightened travel restrictions due to the new Omicron strain of COVID-19. From Tuesday, passengers leaving the UK are required to have proof of a negative test made no earlier than 48 hours before departure. Passengers arriving in the UK are likely to face more stringent checks. These measures, aimed to prevent a new outbreak, are likely to be detrimental for the tourism sector, which could require government support. About 170 confirmed cases of Omicron were reported in the UK last weekend.
Weekly

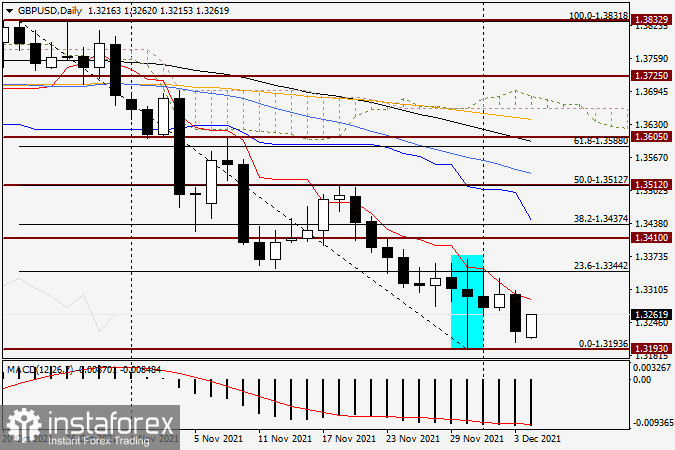
GBP/USD closed on Friday at 1.3229, below the key technical level of 1.3300. The pair closed below the lower border of the Ichimoku cloud, which could be a cause of alarm for bulls. Pushing the weekly closing price up into the Ichimoku cloud could be the main goal for bullish traders this week. If the pair regains 1.3300, it would then push against the orange 200-day EMA line at 1.3385. GBP/USD should finish the week above the 1.3193 support level to extend its upside movement.
Daily

According to the daily chart, the long-legged doji pattern failed to reverse the pair upwards, which encountered strong resistance at the red Tenkan-Sen line of the Ichimoku cloud. Despite Friday's decline, there are still opportunities for bulls, unless GBP/USD performs a real breakout below the support level of 1.3193. If bullish reversal candle patterns emerge in the 1.3200 area at daily or lower timeframes, it would be a strong buy signal. Emerging bearish reversal candle patterns in the key technical zone of 1.3300-1.3330 would signal traders to prepare to open short positions.
Good luck!
 English
 Русский
 Bahasa Indonesia
 Bahasa Malay
 ไทย
ไทย Español
 Deutsch
 Български
 Français
 Tiếng Việt
 中文
中文 বাংলা
বাংলা हिन्दी
 Čeština
 Українська
 Română

