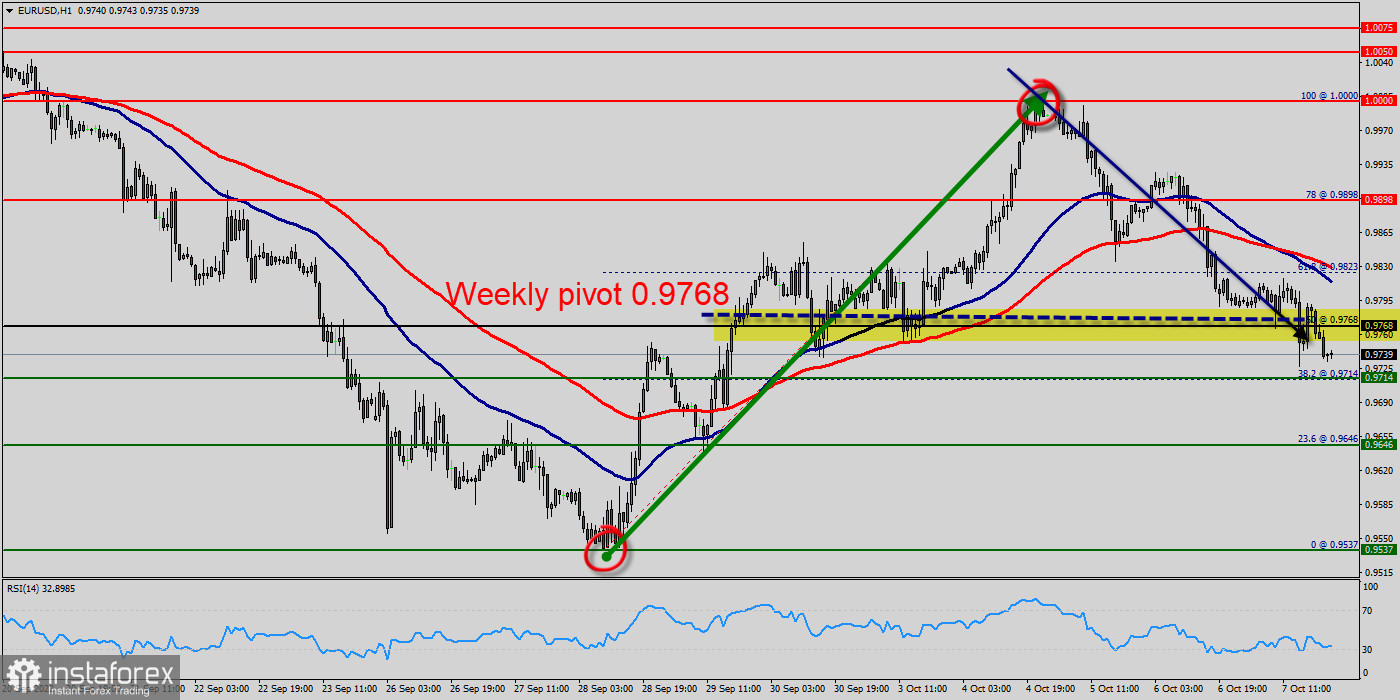
- Weekly pivot point : 0.9768.
- Psychological price : 1 USD.
- Time frame: Hourly (H1).
- Trend : long term bearish & short term bullish.
Overview: The EUR/USD pair's rise from the price of 0.9837 resumes today and accelerates to as high as 0.9920 so far. Immediate concentrate is now on 0.9837 resistance turned support, which is close to 100-day EMA (now at 0.9900). The bullish trend is currently very strong for the EUR/USD pair. As long as the price remains above the resistance at 0.9837, it could try to take advantage of the bullish rally.
The EUR/USD pair has closed above the pivot point (0.9837) could assure that the EUR/USD pair will move higher towards cooling new highs. The bulls must break through 1 USD in order to resume the uptrend. Decisive break their argue that such rally is at least correcting the fall from 0.9868 to set at 0.9837. Also, it should be noted that U.S. inflation was 2.25% in July, holding close to its highest annual rate in four decades despite easing energy costs. The EUR/USD pair retreated from around 0.9837, the 38.2% of Fibonacci retracement of the daily climb measured between 0.9837 and 1 USD, so holds above the former critical resistance, now support at 0.9837.
The EUR/USD pair has broken resistance at the level of 0.9837 which acts as support now. Thus, the pair has already formed minor support at 0.9868. The strong support is seen at the level of 0.9837 because it represents the weekly support 1. Technical readings in the daily chart favor a bullish continuation, as indicators maintain their firmly bullish slopes within positive levels, while the 100 MA heads firmly higher below the current level. Equally important, the RSI and the moving average (100) are still calling for an uptrend. the EUR/USD pair is continuing rising by market cap at a range between 0.9900 and 1.0010 in coming hours. The EUR/USD pair is trading at 0.9900 after it reached 1 USD earlier. The EUR/USD pair has been set above the strong support at the prices of 0.9837 and 0.9868, which coincides with the 38.2% and 50% Fibonacci retracement level.
This support at 0.9837 has been rejected three times confirming the veracity of an uptrend. The market is likely to show signs of a bullish trend around the spot of 0.9837. Buy orders are recommended above the area of 0.9837 with the first target at the price of 0.9950; and continue towards 1 USD in order to test the last bullish wave. The bullish momentum would be revived by a break in this resistance. The second bullish objective is located at 1.0045. Crossing it would then enable buyers to target 1.0100 (buyers would then use the next resistance located at 1.0100 as an objective.).
Be careful, given the powerful bearish rally underway, excesses could lead to a short-term rebound. If this is the case, remember that trading against the trend may be riskier. It would seem more convenient to wait for a signal indicating reversal of the trend.
Weekly conclusion :
The bullish trend is currently very strong on the EUR/USD pair. As long as the price remains above the support levels of 0.9768 and 0.9700, you could try to benefit from the growth. The first bullish objective is located at the price of 0.9823. The bullish momentum would be boosted by a break in this resistance (0.9823). The hourly chart is currently still bullish. At the same time, some stabilization tendencies are visible between 0.9768 and 0.9823 in a few minutes. Together with the relatively large distance to the fast-rising 100-day moving average (0.9823), there are some arguments for a relief rally in coming months on the table. The EUR/USD pair is at highest against the dollar around the spot of 0.9700 and 1 USD for two weeks - the EUR/USD pair is inside in upward channel. The EUR/USD pair decreased within an up channel, for that the EUR/USD pair its new highest 0.9823. Consequently, the first support is set at the level of 0.9768. Hence, the market is likely to show signs of a bullish trend around the area of 0.9823. The general bullish opinion of this analysis is in opposition with technical indicators. As long as the invalidation level of this analysis is not breached, the bullish direction is still favored, however the current short-term correction should be carefully watched. The bulls must break through 0.9823 in order to resume the uptrend to reach the targets of 0.9898 and 1 USD in next week (10th October 2022).
 English
 Русский
 Bahasa Indonesia
 Bahasa Malay
 ไทย
ไทย Español
 Deutsch
 Български
 Français
 Tiếng Việt
 中文
中文 বাংলা
বাংলা हिन्दी
 Čeština
 Українська
 Română

