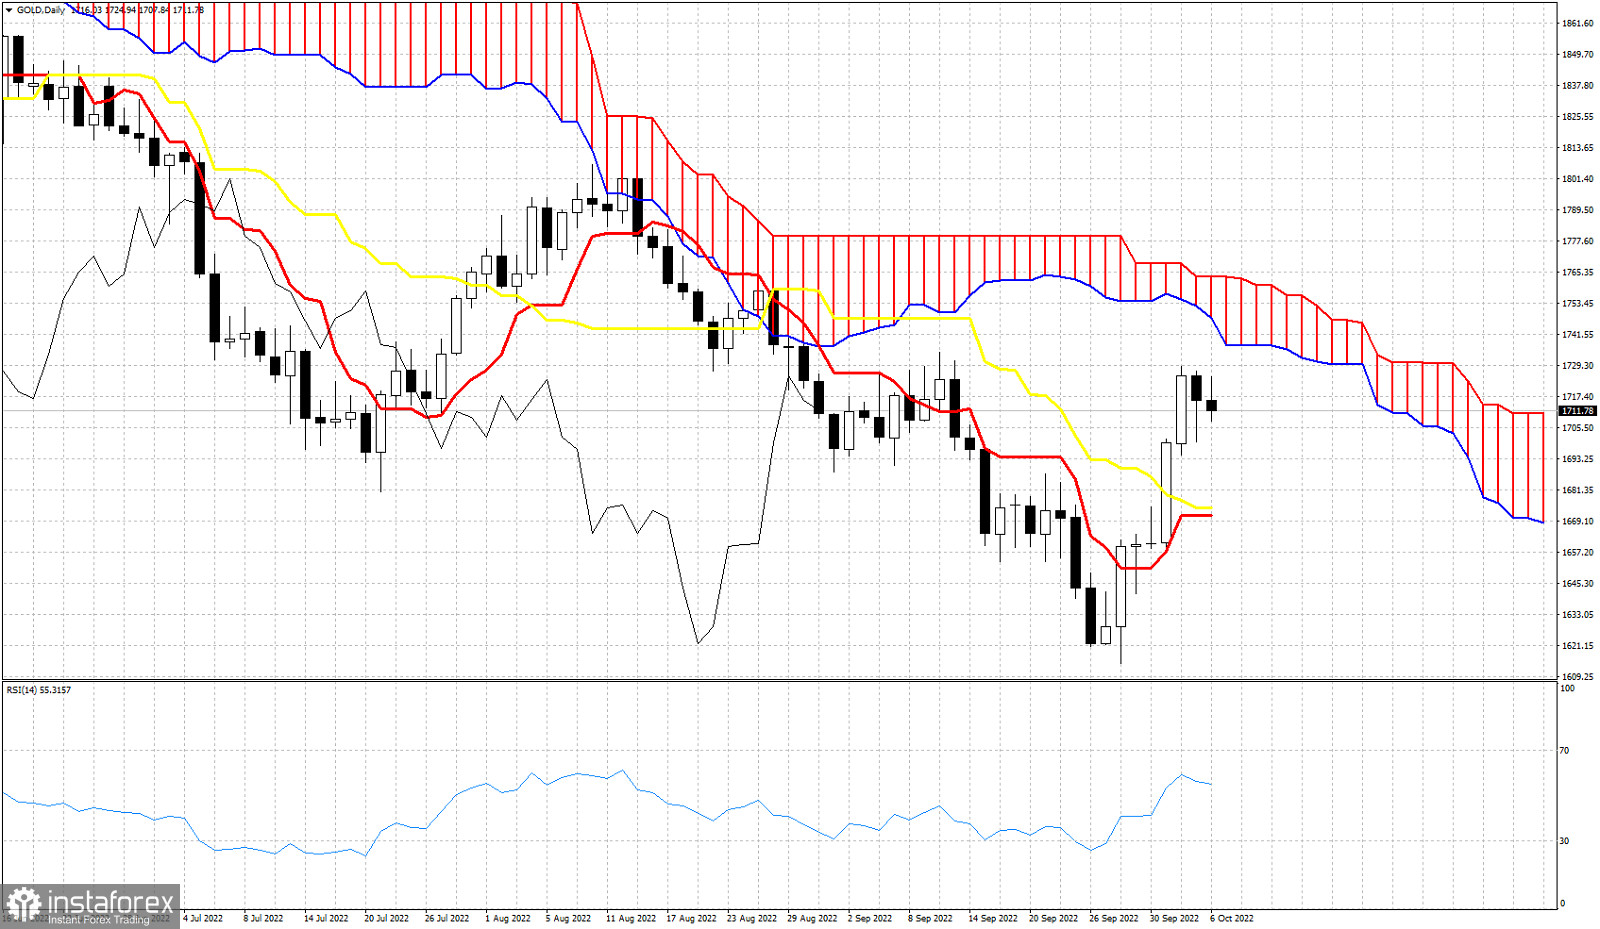
Gold price is trading around $1,710-$1,720. Short-term trend technically and according to the Ichimoku cloud indicator is bullish as price is making higher highs and higher lows and in the 4 hour chart price is above the Kumo (cloud). However in the Daily chart price remains below the Kumo and thus trend is bearish. We talked about the medium-term trend remaining bearish in previous posts. There are still important resistance levels above to break in order for this trend to change. The Ichimoku cloud resistance is at $1,737-$1,763. As long as price is below this resistance area (shown by the Kumo) we remain medium-term bearish and so does the Daily trend. Support is at $1,674-70 where we find the kijun-sen (yellow line indicator) and the tenkan-sen (red line indicator). Bulls must defend this support level. A break below this support level will open the way for a move to new lows. Ideally bulls will back test the support at $1,670-74 and form a higher low. Then a break above the cloud would signal the trend change. Inability to break above the cloud if combined with a break below $1,670 would be a new bearish signal.
 English
 Русский
 Bahasa Indonesia
 Bahasa Malay
 ไทย
ไทย Español
 Deutsch
 Български
 Français
 Tiếng Việt
 中文
中文 বাংলা
বাংলা हिन्दी
 Čeština
 Українська
 Română

