Today, on the first trading day of the new week, we will consider another major currency pair, which is the dollar/franc. The main attention in this article will be paid to the technical analysis of USD/CHF. Taking into account the Friday closing of the last five-day trading week, as well as the beginning of a new week, I suggest starting to consider the technical picture from the weekly chart.
Weekly

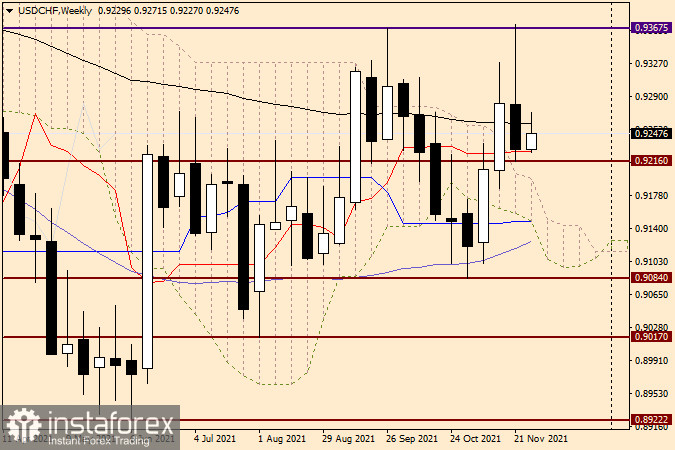
Here the picture is very similar to the one that has developed for the other main currency pair dollar/yen. In addition, in the dollar/franc pair under consideration, both currencies, depending on the circumstances, are protective assets, or, if you like, safe-haven currencies. Although thanks to the efforts of the Swiss National Bank (SNB), which previously restrained the strengthening of its national currency due to strong interventions, this protective status of the franc has faded a little, investors still, albeit with caution, consider the Swiss a safe-haven. Another characteristic feature that has not yet been observed is the strengthening of the US dollar at times of aggravation of the situation with the COVID-19 epidemic. Despite the appearance of a new South African strain of this infection, investors are in no hurry to go to the dollar, preferring other options to the "American", in particular, the Swiss franc. However, in my deep conviction, the technical picture of USD/CHF also played an important role. As can be seen on the weekly price chart, during trading on November 22-26, bulls for a pair tried to overcome a rather strong resistance of sellers at 0.9367. What came of it can be judged by the last weekly candle. Having reached the level of 0.9372, the exchange rate turned sharply in the young direction and began to actively decline. During the downward dynamics, the black 89 exponential moving average was broken, and the pair was saved from the subsequent fall by the red Tenkan line of the Ichimoku indicator. USD/CHF was also supported by the 0.9216 level, where the lows of the previous week's trading were shown. At the beginning of the trading of the current five-day period, the bulls on the instrument decided to correct the situation and began to move the course up, but already at 0.9271 their strength left them, and the bullish candle, at the time of writing, began to melt. Now about the immediate tasks of the warring parties. To continue the bearish scenario, a true breakdown of the Tenkan red line, the support of 0.9216, and the closing of the week below the significant 0.9200 mark are necessary. Bulls have no choice but to storm the high bar raised by themselves in the form of resistance in the area of 0.9370 again. Judging by the weekly chart, the bearish scenario looks the most preferable.
Daily

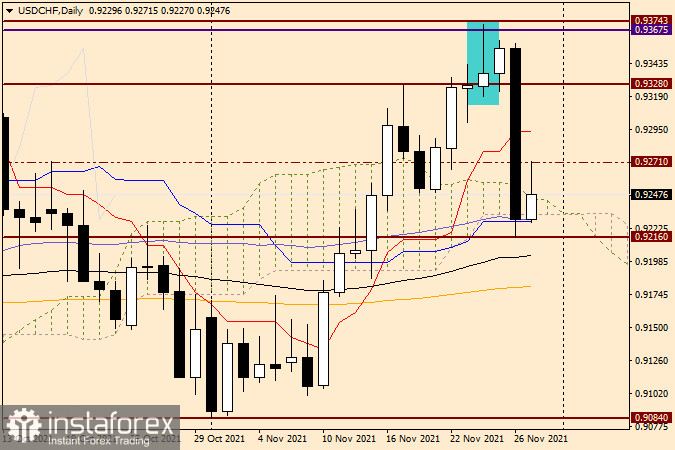
Friday's collapse of the US dollar was preceded by the appearance of a dedicated candle for November 24. The next day, the bulls on the instrument set out to resume growth, the main purpose of which was to absorb a selected candle with a very long upper shadow (to close trading above this very shadow). As you can see, the strength of the players to increase the exchange rate was not enough, and the very next day there was a collapse of USD/CHF. On my behalf, I would like to add that such falls do not just happen, as a rule, they herald a change in trend. If this assumption is correct, then we are preparing to sell USD/CHF after minor corrective pullbacks to the levels of 0.9250 and 0.9300. However, today, the pair has almost reached the first mark, after which the bullish body of the candle began to melt. To summarize, according to the author's personal opinion, sales look like the main trading idea. Considering that the rollback to 0.9250 has already taken place, aggressively and riskily you can try to sell right now, on the market. Another option for opening short positions will be alternate breakouts of the 0.9216 and 0.9200 levels. In this case, after a pullback to the 0.9200-0.9216 price zone, and the appearance of bearish reversal candles on this or smaller charts there, you can try opening deals for sale.
 English
 Русский
 Bahasa Indonesia
 Bahasa Malay
 ไทย
ไทย Español
 Deutsch
 Български
 Français
 Tiếng Việt
 中文
中文 বাংলা
বাংলা हिन्दी
 Čeština
 Українська
 Română

