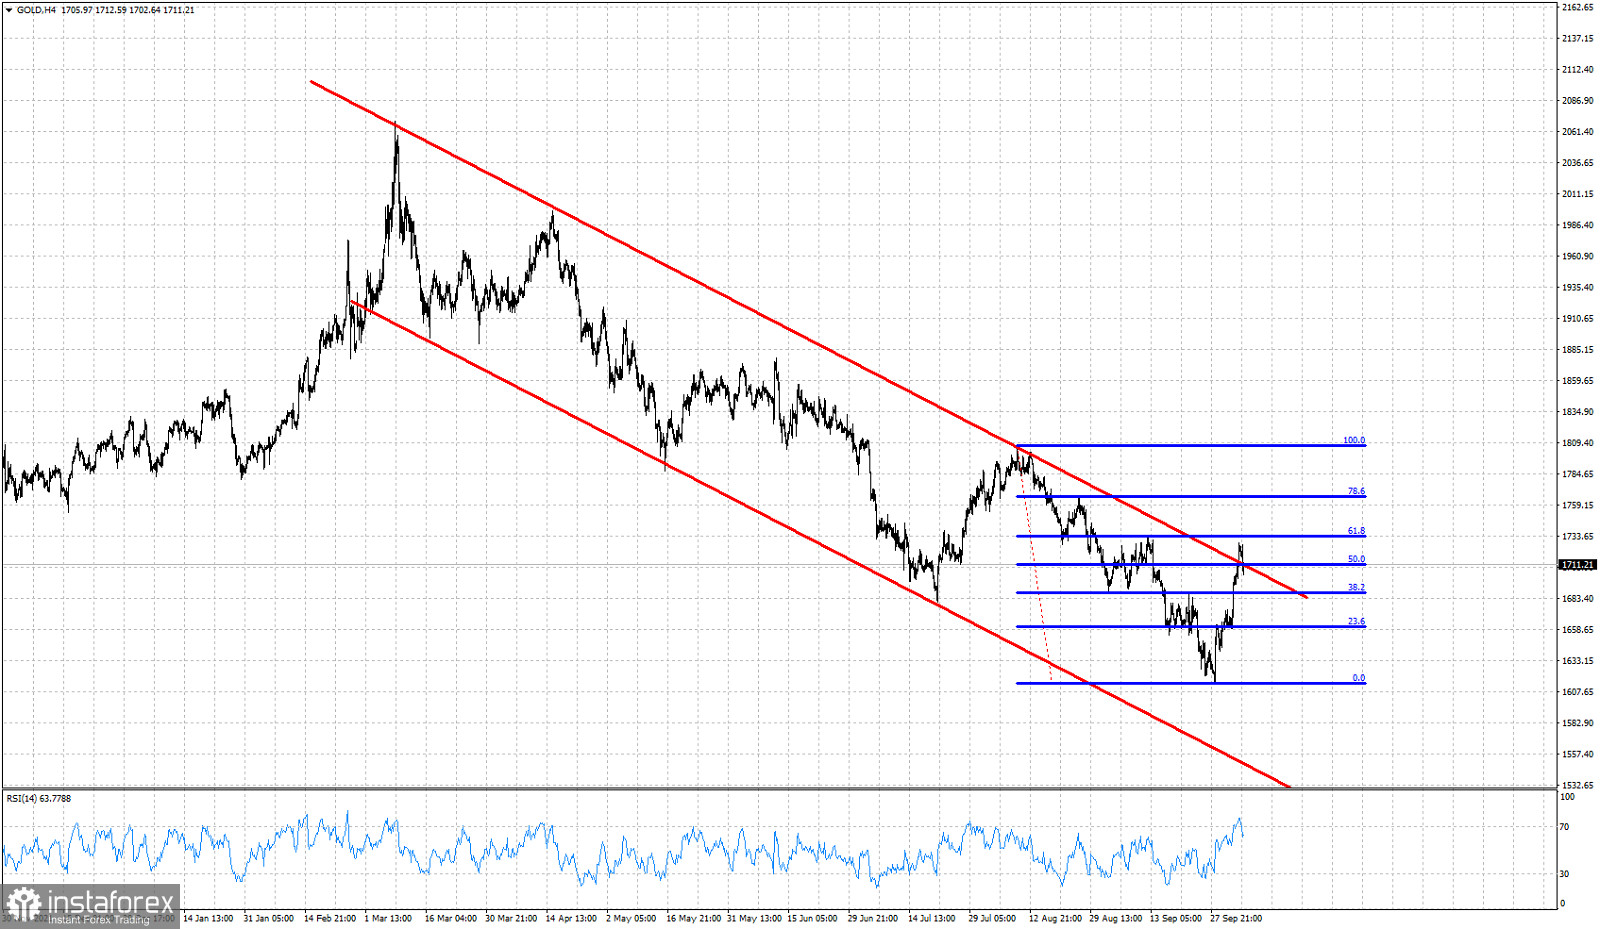
Red lines -bearish channel
blue lines- Fibonacci retracement levels
Gold price is trading above $1,700. Price has moved as high as $1,728 yesterday and today is at $1,713. Short-term trend is bullish as price is making higher highs and higher lows. Price has marginally broken out of the medium-term bearish channel. However traders need to focus on the Fibonacci level we are currently trading. As expected Gold has almost reached the 61.8% Fibonacci retracement and we are showing the first signs of a pull back. The RSI has reached overbought levels and is turning lower. It is not necessary to continue higher, the corrective bounce could very well be over. It is important to see how price reacts around the 61.8% retracement. Will Gold price re-enter the bearish channel and start making lower lows and lower highs? This is what bears would want to see. Gold will have formed a new lower high relative to the $1,807 high and will be starting a new down trend for new lows below $1,600. On the contrary bulls want to see price starting to make higher lows and higher highs in order to confirm the exit from the bearish channel and the start of a new up trend.
 English
 Русский
 Bahasa Indonesia
 Bahasa Malay
 ไทย
ไทย Español
 Deutsch
 Български
 Français
 Tiếng Việt
 中文
中文 বাংলা
বাংলা हिन्दी
 Čeština
 Українська
 Română

