4-hour timeframe

Technical details:
Higher linear regression channel: direction - downward.
Lower linear regression channel: direction - downward.
Moving average (20; smoothed) - downward.
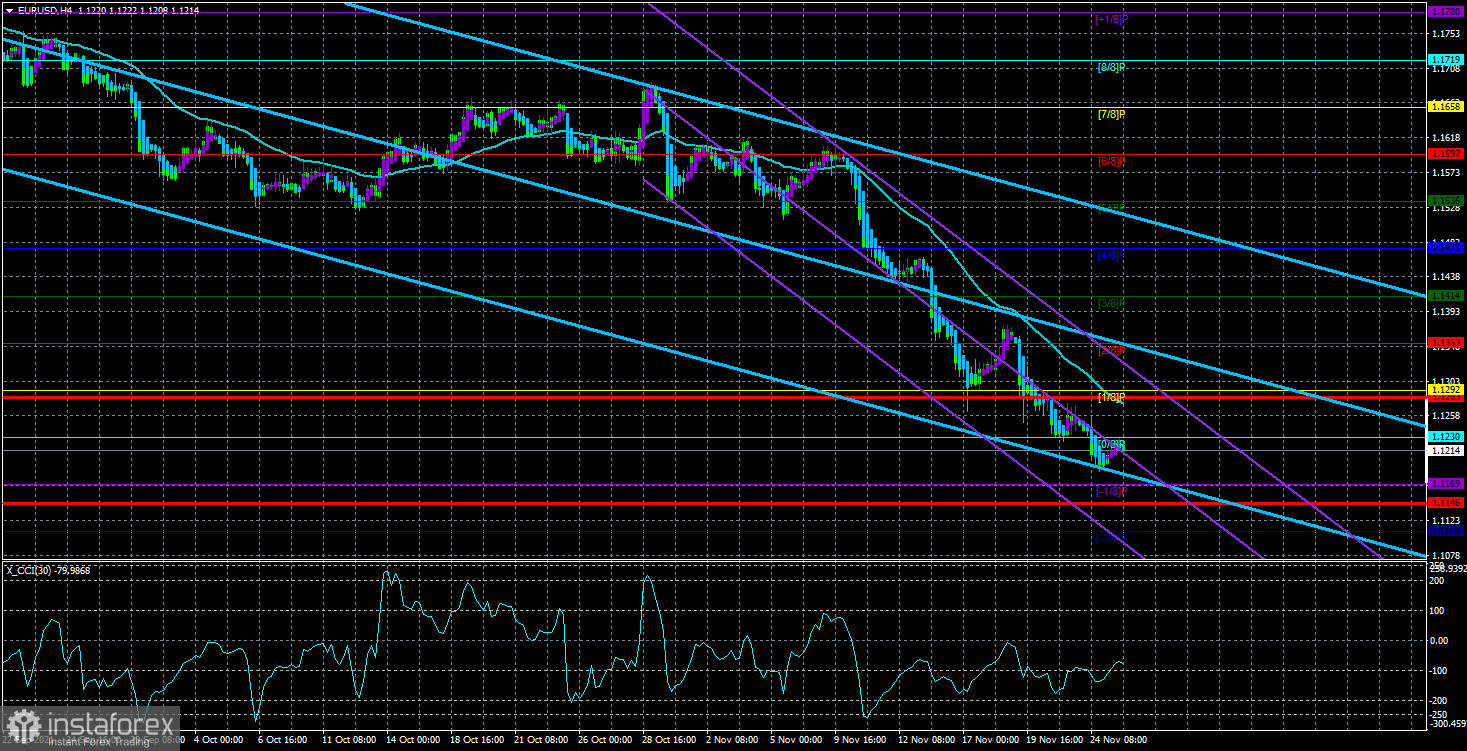
The EUR/USD currency pair continued its downward movement slowly and unhurriedly on Thursday. Those small pullbacks that the pair demonstrates from time to time do not play any role. It is hardly necessary to pay attention to every pullback of 30-40 points and say that the fall of the European currency has stopped. It goes on and on almost every day. Moreover, it does not even matter whether there are macroeconomic statistics or a "foundation" on a particular day, or at least disappointing news for the euro, or not. If just a month ago the euro/dollar pair could stand in one place for 3-4 days and then show normal volatility for one day, now the pair is just falling every day. That's how the picture on the foreign exchange market changes in the blink of an eye. We have already talked repeatedly about the possible reasons for the strong fall of the euro and the growth of the dollar. Exactly what about "possible", because most of these reasons were relevant a few months ago when the pair stood still and showed volatility of about 40 points every day. Nevertheless, closer to the New Year, most market participants have become more active, which leads to the fact that the US dollar is strengthening by 4 cents in a couple of weeks. Nothing was interesting in terms of news or "foundation" on Wednesday. Nevertheless, the upward correction has not started, which, as well as possible, shows the lack of desire among traders to fix profits on short positions. The technical picture also does not cause any questions and doubts. All indicators are directed downwards, the downward trend is evident. Thus, at this time, there is not a single sign of the completion of the downward movement.
Isabelle Schnabel and Jens Weidmann are ready to complete PEPP.
Yesterday, we already covered the topic of the "coronavirus" in the European Union. It will not be repeated. However, along with the difficult situation with the fourth "wave" of the pandemic, the EU economy is also experiencing certain problems. Moreover, these problems are permanent, and not provoked by the pandemic that has worsened in recent months. Let's pay attention to the Eurozone GDP figures for the last 4 quarters. What do we see? -0.4%, -0.3%, +2.1%, +2.2%. For example, in the States, the figures for the same period are as follows: +4.5%, +6.3%, +6.7%, +2.1%. The value of +2.1%, which is considered a "serious slowdown" in the United States, is the "maximum acceleration" in the European Union over the past year. Based on this, are there any other questions why the ECB is not currently thinking about raising the rate even in 2022? The EU economy is still weak and has been so in the last year. This is exactly what we talked about in the first paragraph. The weakness of the EU economy was known a few months ago, but at that time the markets did not consider it necessary to sell the euro based on this factor. Now, most likely, the biggest role is played by possible changes in the monetary policy of the ECB and the Fed. As we have said more than once, the Fed is set to tighten, reduce QE and raise rates in 2022. In the case of the ECB, we are talking about the end of the PEPP program in March 2022, a simultaneous increase in the APP program, and we are not talking about an increase in the rate, which remains negative and lower than in the US and the UK.
Nevertheless, ECB representatives Isabel Schnabel and Jens Weidmann said the other day that the emergency asset purchase program of PEPP needs to be completed on time, as inflation continues to accelerate. In Germany, it is expected that the consumer price index may rise to 6% and begin to gradually decline next year until it reaches the level of 2.5-3.0%. However, the statements of Schnabel and Weidmann did not come as something unexpected for the market. There was no talk about extending the terms of PEPP, Christine Lagarde also did not say a word about something like that. Thus, in the European Union, everything is just going according to plan. And there is nothing "hawkish" in the rhetoric of the ECB representatives now. Therefore, the euro currency did not react in any way to the willingness of some ECB members to complete the stimulus program on time.

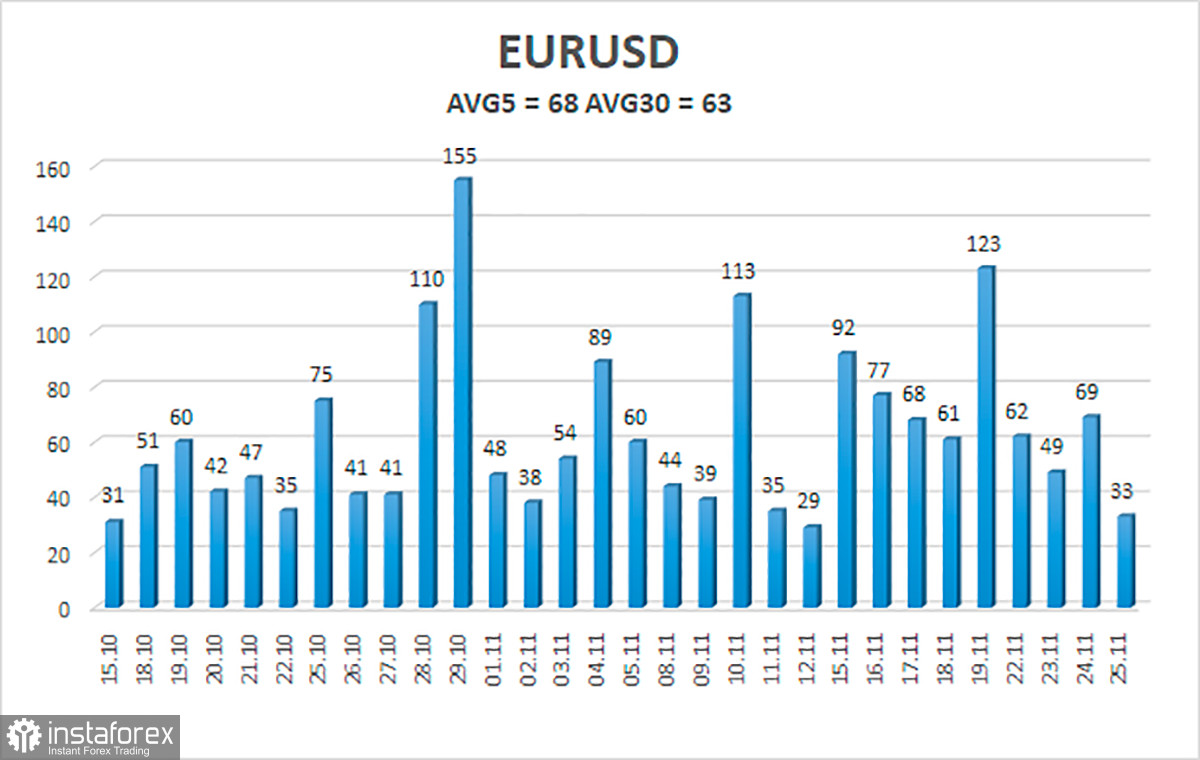
The volatility of the euro/dollar currency pair as of November 26 is 68 points and is characterized as "average". Thus, we expect the pair to move today between the levels of 1.1146 and 1.1283. The reversal of the Heiken Ashi indicator downwards signals the resumption of the downward movement.
Nearest support levels:
S1 – 1.1169
S2 – 1.1108
Nearest resistance levels:
R1 – 1.1230
R2 – 1.1292
R3 – 1.1353
Trading recommendations:
The EUR/USD pair maintains a downward movement. Thus, today you should stay in sell orders with targets of 1.1169 and 1.1146 (or open new ones) until the Heiken Ashi indicator turns up. Purchases of the pair should be considered if the price is fixed above the moving average, with targets of 1.1353 and 1.1414.
Explanations to the illustrations:
Linear regression channels - help determine the current trend. If both are directed in the same direction, then the trend is strong now.
Moving average line (settings 20.0, smoothed) - determines the short-term trend and the direction in which trading should be conducted now.
Murray levels - target levels for movements and corrections.
Volatility levels (red lines) - the likely price channel in which the pair will spend the next day, based on current volatility indicators.
CCI indicator - its entry into the oversold area (below -250) or into the overbought area (above +250) means that a trend reversal in the opposite direction is approaching.
 English
 Русский
 Bahasa Indonesia
 Bahasa Malay
 ไทย
ไทย Español
 Deutsch
 Български
 Français
 Tiếng Việt
 中文
中文 বাংলা
বাংলা हिन्दी
 Čeština
 Українська
 Română

