 English
  Русский
 Bahasa Indonesia
 Bahasa Malay
 ไทย
ไทย Español
 Deutsch
 Български
 Français
 Tiếng Việt
 中文
中文 বাংলা
বাংলা हिन्दी
 Čeština
 Українська
 Română

Trend analysis (Fig. 1)
On Thursday, the price is expected to rise from 1.3322 (the closing level of yesterday's daily candlestick). The target is seen at the 23.6% retracement level (1.3361, blue dotted line). The upward trend is likely to extend if the quote tests this mark. If so, the target will be seen at the 38.2% retracement level (1.3390, blue dotted line).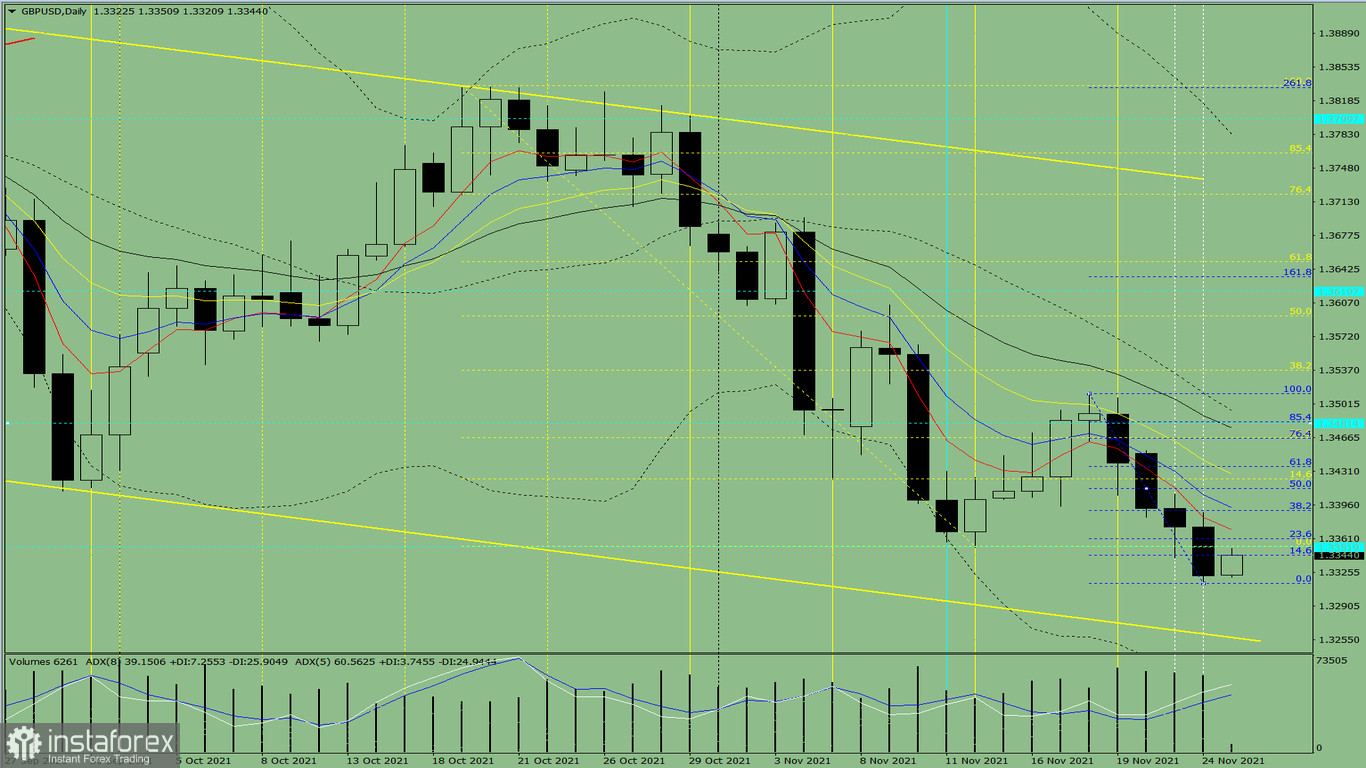
Fig. 1 (daily chart)
Comprehensive analysis:
- indicator analysis - uptrend
- Fibonacci retracement analysis - uptrend
- volume analysis - uptrend
- candlestick analysis - uptrend
- trend analysis - uptrend
- Bollinger bands analysis - uptrend
- weekly chart analysis - uptrend
Conclusion:
Today, the price is expected to rise from 1.3322 (the closing level of yesterday's daily candlestick). The target is seen at the 23.6% retracement level (1.3361, blue dotted line). The upward trend is likely to extend if the quote tests this mark. If so, the target will be seen at the 38.2% retracement level (1.3390, blue dotted line).
Alternatively, the price may head towards the historic resistance level of 1.3352 (blue dotted line) from 1.3322 (the closing level of yesterday's daily candlestick). If the quote tests this mark, the downtrend may resume with the target at the support line of 1.3258 (yellow bold line). In case of a test there, the price may retrace upward.