Wave pattern
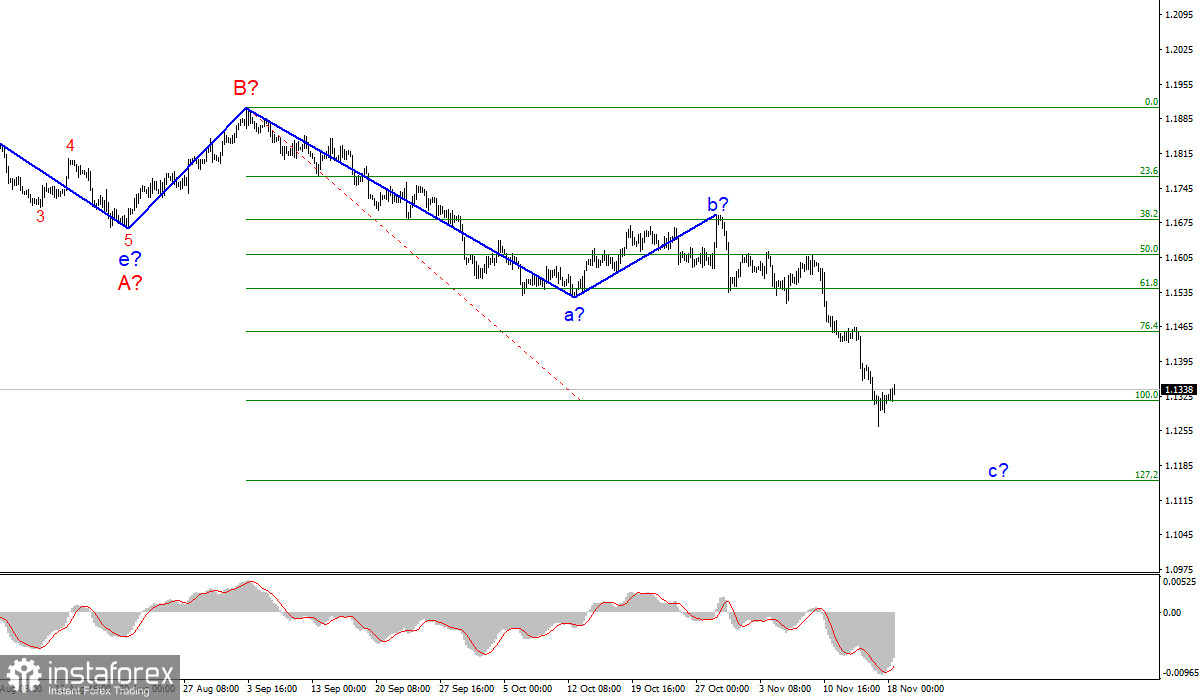
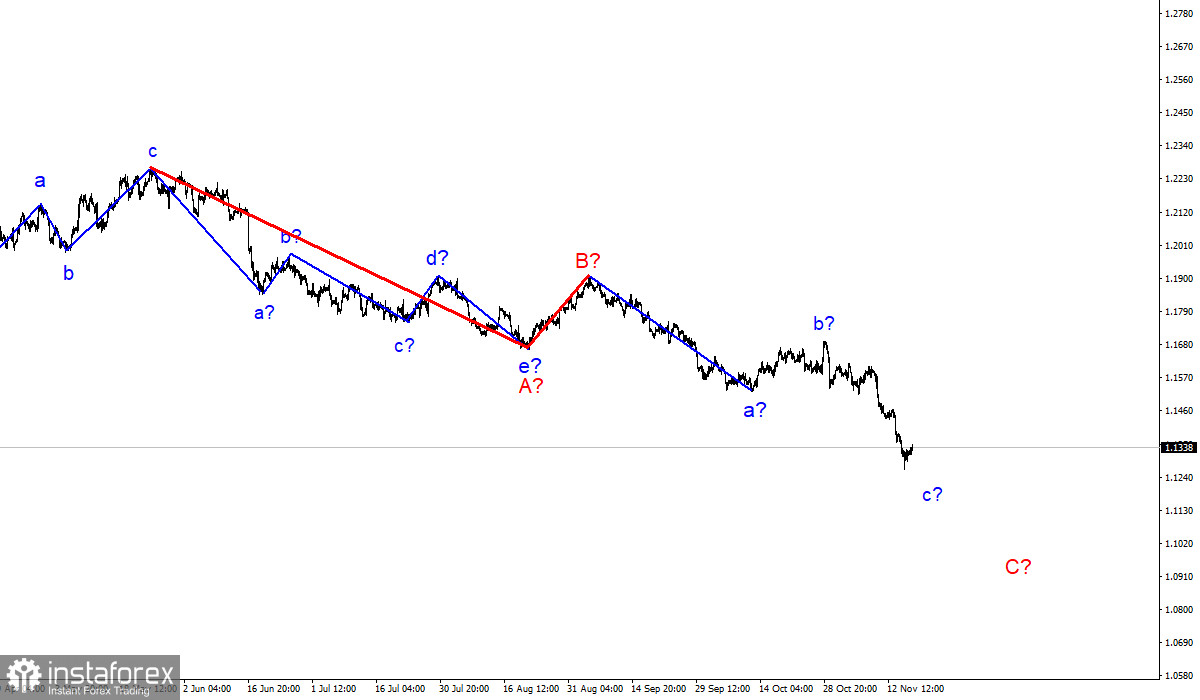
The wave counting of the 4-hour chart for the Euro/Dollar instrument continues to remain integral. The plot a-b-c-d-e, which has been forming since the beginning of the year, is interpreted as wave A, and the subsequent increase of the instrument is interpreted as wave B. Thus, the construction of the proposed wave C is now continuing, which can also take a very extended form.
If the current wave counting is correct, then the construction of the proposed wave c in C is now continuing. And the entire wave C can also turn out to be a five-wave one. Its targets are located near the calculated marks of 1.1314 and 1.1153, which corresponds to 100.0% and 127.2% Fibonacci levels.
A successful attempt to break through the 1.1314 mark will indicate the readiness of the markets for further sales of the instrument. An unsuccessful attempt to break through 1.1314 may herald the completion of the construction of wave c in C. However, I believe that wave c may take on an even more extended form.
The dollar is well positioned to advance towards the 1.1150 level.
There was no news background for the EUR/USD instrument on Thursday. There was nothing interesting either in the USA or in Europe. Several FOMC members are scheduled to give speeches today, but all of them will take place either in the evening or at night. Thus, during the day nothing affected the mood of the markets and the movement of the Euro/Dollar instrument.
Therefore, we can only pay attention so far to the wave analysis. If we try to disassemble wave c in C into sub-waves, it turns out that it shows an elongation inside wave 3. That is, wave 3 also takes a five-wave form. If this is true, then the construction of wave 3 in 3 in c in C has now been completed.
After a slight exit of quotes from the reached lows, the decline may resume within the wave 5 in 3 in c in C. And a little later - within the wave 5 in c in C. Thus, I think that the decline in quotes to the level of 1.1154, which corresponds to 127.2% Fibonacci level, is very likely.
This week, the information background is very weak, nevertheless, in its first days, the instrument showed enviable dynamics. This dynamics was necessary in order to build a convincing third wave, which in impulse structures should be much longer than the first or fifth wave.
And so far, wave c looks like an impulse wave, which means its last waves should also fit into the overall wave picture. Thus, the decline of the European currency may not be completed yet, and the entire wave C may take a five-wave form, which will allow us to expect a decline below the 10th figure.
General conclusions
Based on the analysis, I conclude that the construction of the downward wave C will continue. Therefore, now I advise you to continue selling the instrument for each downward signal from the MACD, with targets located near the estimated mark of 1.1153, which corresponds to 127.2% Fibonacci level, and below. The attempt to break the 1.1314 mark looks successful so far.
The wave counting of the higher scale looks quite convincing. The decline in quotes continues and now the downward section of the trend, which originates on May 25, takes the form of a three-wave corrective structure A-B-C. Thus, the decline may continue for another month or two until wave C is fully completed.
 English
 Русский
 Bahasa Indonesia
 Bahasa Malay
 ไทย
ไทย Español
 Deutsch
 Български
 Français
 Tiếng Việt
 中文
中文 বাংলা
বাংলা हिन्दी
 Čeština
 Українська
 Română


