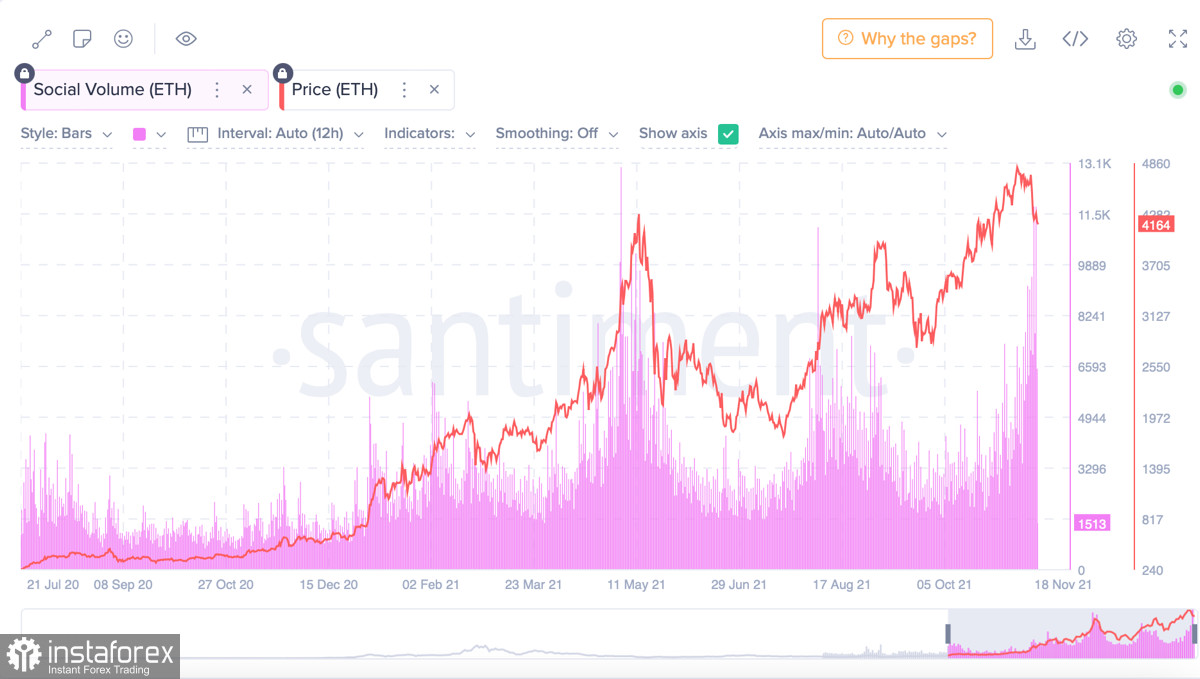
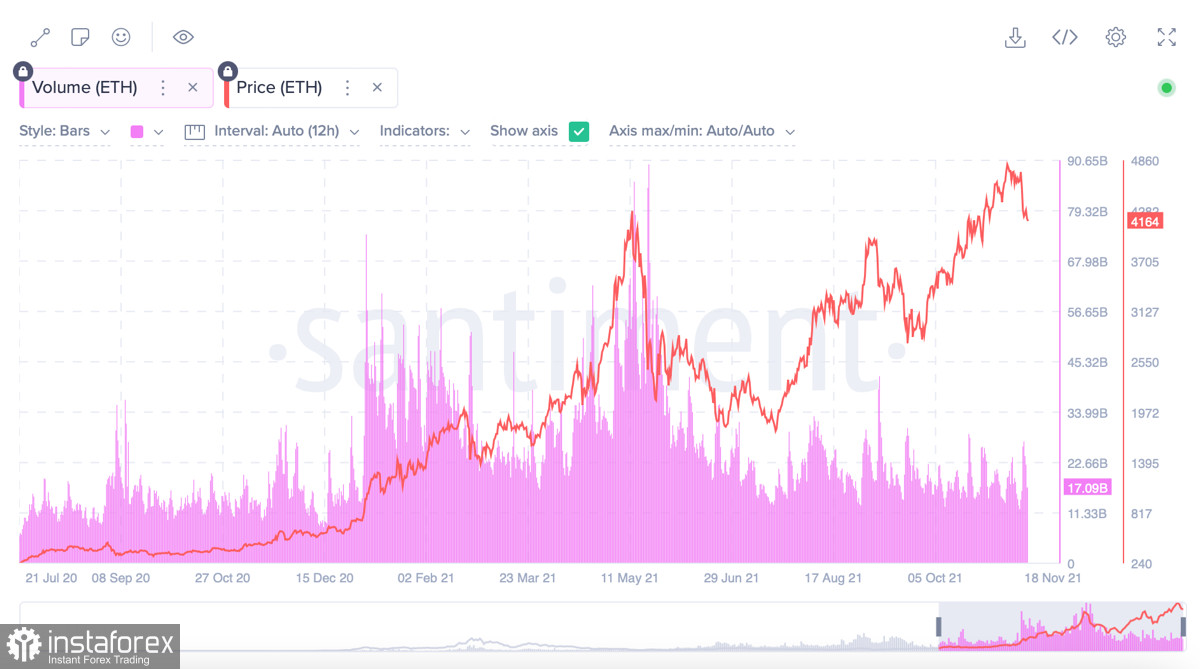
After a one-month rally, ether has entered the correctional phase, which is nearing completion. Bulls were gathering strength near the support level around $4.2k. However, they failed to hold the price at this level. So, it is gradually decreasing to $4k where the key resistance level is located. Importantly, the downward movement occurs simultaneously with growing on-chain activity. This divergence may signal further decline.
The coin network has a high user activity and a significant influx of new market players. This indicates bulls' activity as they are waiting for a moment to enter the market. Transaction volumes showed a similar dynamic. They remain at a high level, indicating high demand for ether. Notably, demand for ether in networks jumped as well, signaling an increase in purchases. At the same time, the divergence between the on-chain activity and the price gradually disappears amid the correction. This is why the price may rebound from $4k. The growth of on-chain indicators also signals a rally. Therefore, if on-chain activity counties to advance, ether may approach $4k and end a correction.


Raoul Pal, a former Goldman Sachs analysts is sure that in December, ether may jump to $20k according to the bitcoin pattern for 2017. When this pattern was formed, the price surged by 100%. Raoul Pal believes that altcoin is likely to rally as well and grow more than three times in just one month. This outlook looks too optimistic. The main target levels for ether in 2021 are $5k, $6k, and $6.8 k. The formation of a similar pattern does not guarantee the repetition of the scenario. Apart from that, some factors may intervene and affect the movement of the coin.
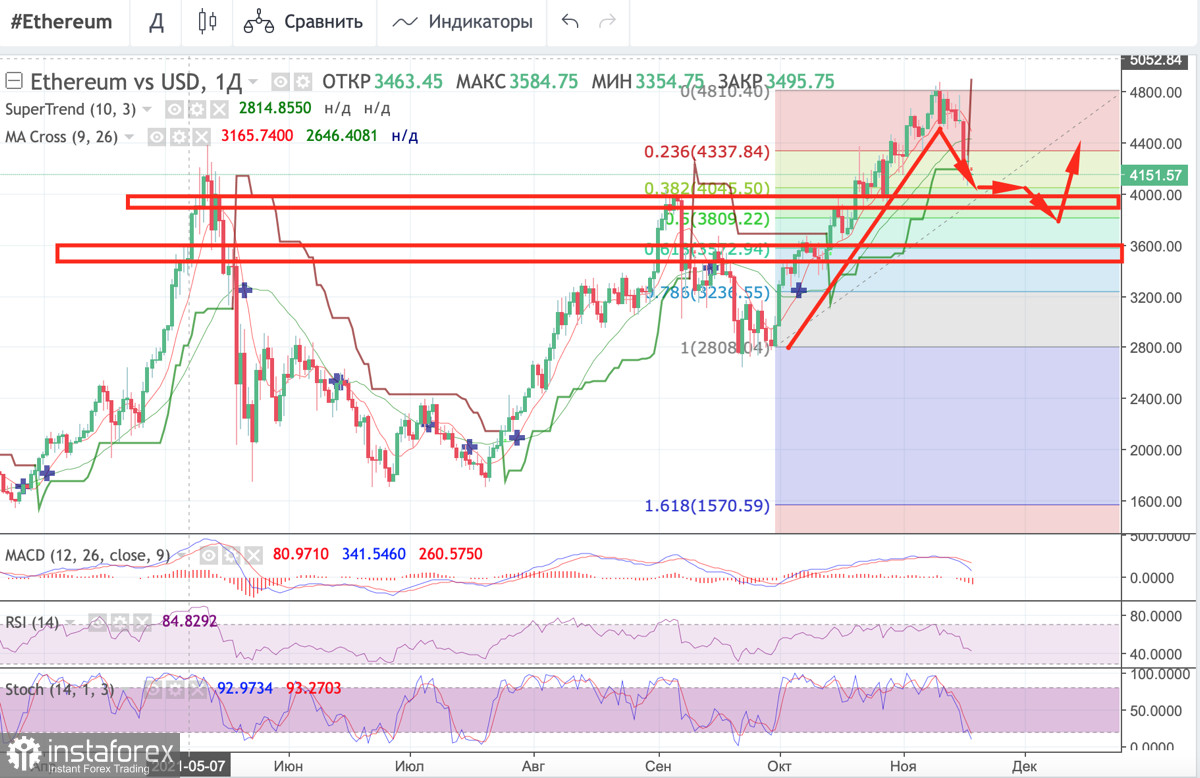
On the daily chart, ether keeps declining despite bulls' attempts to recoup losses. The price hit $4.1k but later the bulls managed to push the price above $4.2k. After the successful rebound, the ETF/USD pair performed a bearish breakout of the super trend line. The bearish bias is strong. Technical indicators signal a decline to $4.1k. The MACD indicator is building a bearish intersection. It may soon tumble below the zero mark. The stochastic oscillator left the positive zone and slid below the 40 mark. The relative strength index may also soon leave the positive zone, indicating the strength of a downward movement. The nearest key support level for ether is located around $ 4k and coincides with the Fibonacci retracement level of 0.5. On November 17, bears tried to push the price below this level, but there was a rebound. It means that a powerful support area has formed there. If the price breaks below this level, the downward correction may continue. It will be possible to make a more precise forecast about the correctional movement after the next test of the Fibonacci retracement level of 0.5 and the further trajectory of the price.

In case of a rebound, ETH is likely to trade within a narrow range of $4k-$4.2k. After that, it may retest $4k again or make an upward reversal. With the subsequent breakout of this level, the price may continue to decline to $3.6k-$3.8k, where the Fibonacci retracement level of 0.618 passes. Taking into account the growing on-chain activity, as well as bulls' willingness to defend the support level, the price may break below $4k, sliding to the range of $3.6k-$3.8k. It is recommended to open long positions at these levels as the price may rebound from this range. It may rise to $5.6k-$7k.
 English
 Русский
 Bahasa Indonesia
 Bahasa Malay
 ไทย
ไทย Español
 Deutsch
 Български
 Français
 Tiếng Việt
 中文
中文 বাংলা
বাংলা हिन्दी
 Čeština
 Українська
 Română

