In the absence of important macroeconomic events, I propose today to look again at the technical picture that is observed for the dollar/ franc currency pair and estimate possible positioning options for this very interesting trading instrument.
Daily

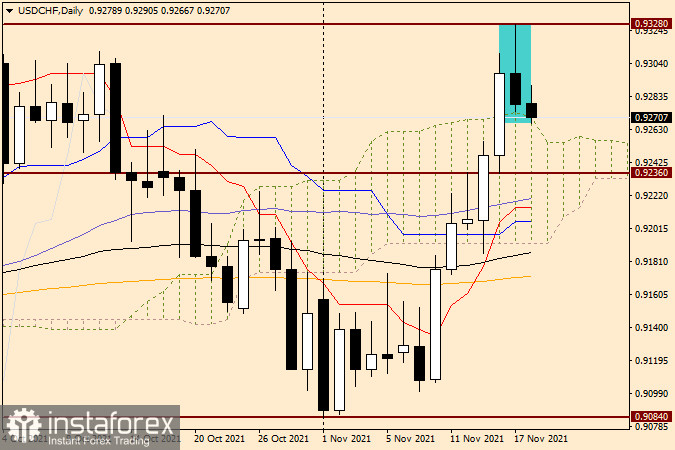
After the rather impressive growth shown last week, at the auction of the current five-day period, the situation regarding the dollar/franc price movement does not look so unambiguous. The beginning of trading was left to the bulls for USD/CHF. As you can see, in the first two trading days of this week, the pair were actively growing, continuing the upward dynamics shown at last week's trading. However, yesterday, as a result of attempts to overcome the strong and significant technical level of 0.9300 for the market, bulls on the instrument had a misfire. After rising to the level of 0.9328, the pair met strong resistance from sellers here and turned sharply in the south direction. As a result, a bearish candle with a rather impressive upper shadow and a closing price of 0.9278 appeared on the USD/CHF daily chart. In my personal opinion, the current situation can be viewed from different points of view.
After a confident exit up from the Ichimoku indicator cloud, which occurred on November 16, the pair rolled back to the broken upper border of the cloud the next day. Such a version has the technical prerequisites for its right to exist. On the other hand, the complete loss of the bulls' initiative on the instrument at yesterday's auction and the reversal shape of the candle on November 17 itself force us to think about the end of growth and a possible reversal of the quote. I think that the moment with the Ichimoku indicator cloud will clarify a lot. If the pair returns to its limits and gains a foothold there, the exit from the cloud will have to be considered false and count on a subsequent depreciation. If strong support is found on the broken upper border of the cloud and a reversal for the continuation of the upward dynamics, most likely, a retest of the resistance level that formed yesterday at 0.9328 will follow. Thus, a lot will depend on the shape of today's daily candle and its closing price relative to the limits of the Ichimoku cloud.
H1

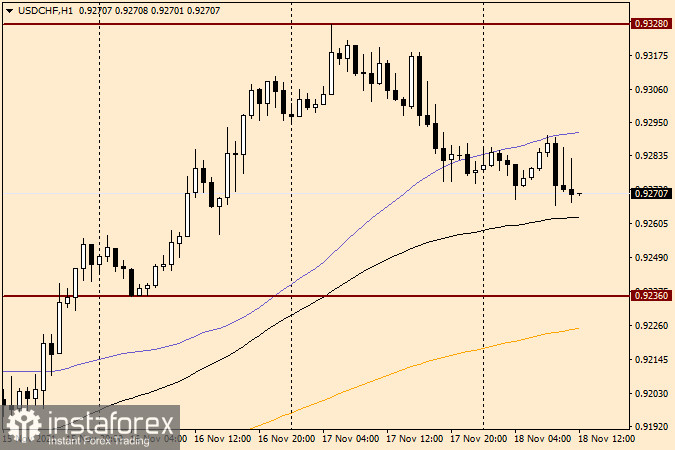
On the hourly chart, the current resistance to growth attempts is provided by the 50 simple moving average, which runs at 0.9291. In the event of a breakdown of 50 MA and the closure of three consecutive daily candles over this moving, on a rollback to it, you can try purchases with small goals in the area of 0.9305-0.9325. Exactly the same tactics should be followed in the case of a true breakdown of the resistance level of 0.9328, after which, on a rollback to this broken mark, consider options for opening long positions. If a candle or a combination of candles appears in the selected price zone, indicating a decline in the exchange rate, we are preparing for sales. And in conclusion, I would like to draw attention to the fact that the current technical picture for USD/CHF is far from unambiguous, so staying out of the market for this currency pair would not be the worst positioning option.
 English
 Русский
 Bahasa Indonesia
 Bahasa Malay
 ไทย
ไทย Español
 Deutsch
 Български
 Français
 Tiếng Việt
 中文
中文 বাংলা
বাংলা हिन्दी
 Čeština
 Українська
 Română

