 English
  Русский
 Bahasa Indonesia
 Bahasa Malay
 ไทย
ไทย Español
 Deutsch
 Български
 Français
 Tiếng Việt
 中文
中文 বাংলা
বাংলা हिन्दी
 Čeština
 Українська
 Română

Trend analysis (Fig. 1).
On Wednesday, the price is expected to extend its upward movement from the closing level of the previous daily candlestick (1.3425) to the 23.6% retracement level of 1.3466 (yellow dotted line). The upward trend is likely to continue in case the pair tests this mark. If so, the target is seen at the 38.2% retracement level of 1.3537 (yellow dotted line).
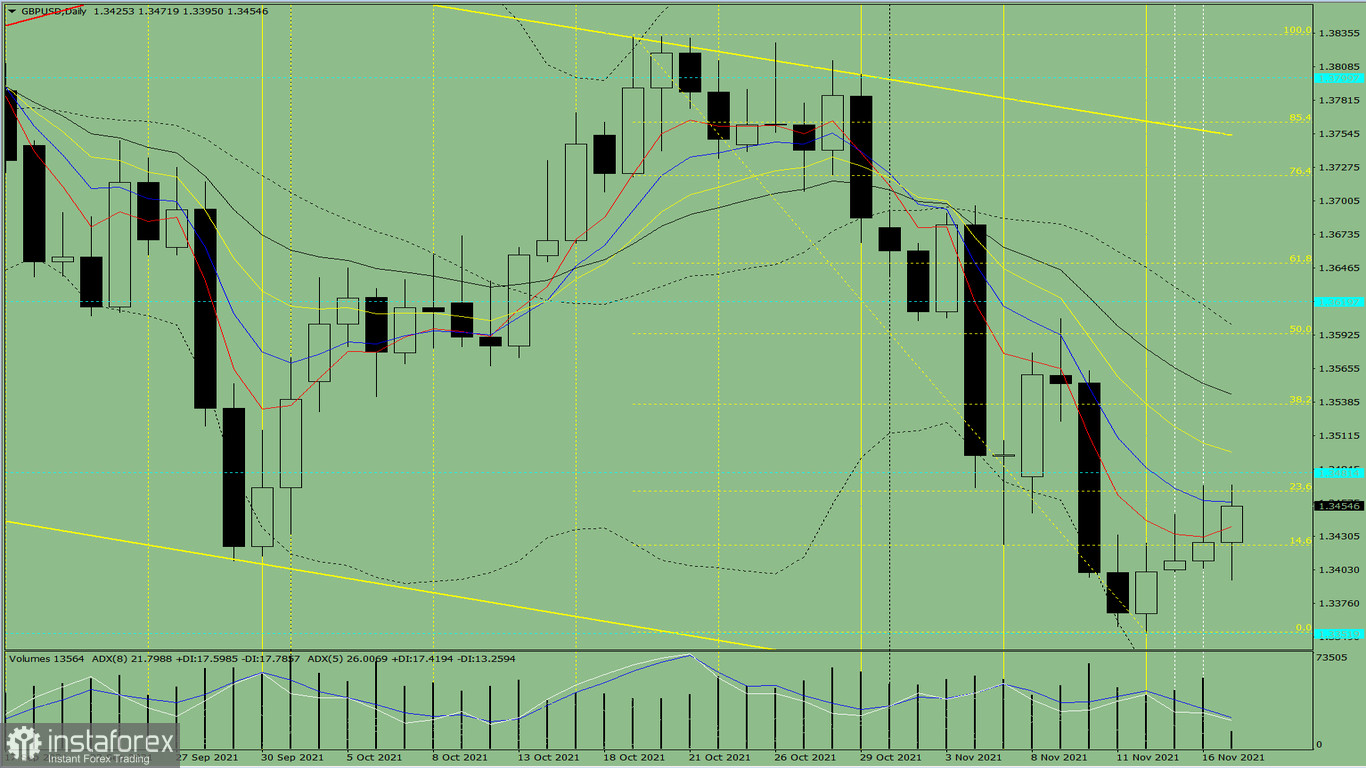
Fig. 1 (daily chart).
Comprehensive analysis:
- indicator analysis - uptrend
- Fibonacci analysis - uptrend
- volume analysis - uptrend
- candlestick analysis - uptrend
- trend analysis - uptrend
- weekly analysis - uptrend
- Bollinger bands analysis - uptrend
Conclusion:
Today, the price is expected to extend its upward movement from the closing level of the previous daily candlestick (1.3425) to the 23.6% retracement level of 1.3466 (yellow dotted line). The upward trend is likely to continue in case the pair tests this mark. If so, the target is seen at the 38.2% retracement level of 1.3537 (yellow dotted line).
Alternatively, the price may go up to the 23.6% retracement level of 1.3466 (yellow dotted line) from the closing level of the previous daily candlestick (1.3425). After a test of the retracement level, the quote may go down to the lower fractal (1.3402) (yellow dotted line). If so, the uptrend will continue.