Today, on the first trading day of the new week, I propose to consider another interesting and widely revered AUD/USD currency pair. This review will be devoted to reviewing the technical picture of this tool, and since this pair was recently considered, I will be brief.
Weekly

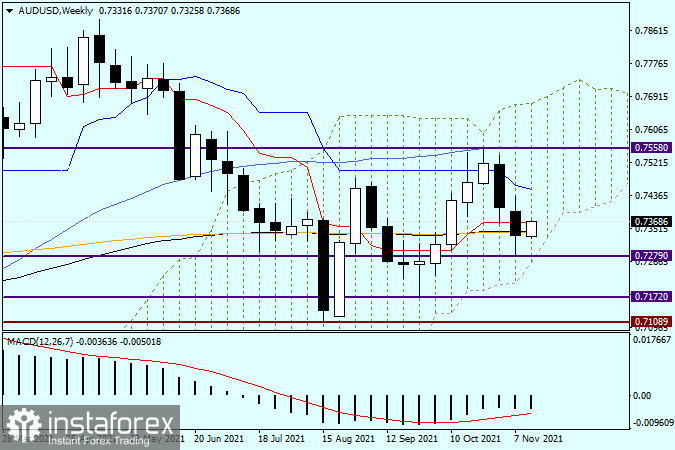
So, as a result of the large-scale strengthening of the US dollar, at the auction on November 8-12, the AUD/USD pair showed a downward trend. Weekly trading ended quite a bit below the black 89 and orange 200 exponential moving averages. It would be quite logical to assume that these moves will provide tangible support to the quote, and it will be far from easy to pass them down. The fact that so far there is only one candle, and even then, not so obviously, it has closed below 89 and 200 exponential does not mean at all that the bulls have thrown out a white flag according to the "Australian". In addition, the pair continues to trade within the Ichimoku indicator cloud, which is considered to be a zone of uncertainty. Confirmation of the above is the growth of the pair, which it demonstrates at the time of writing this article. As you can see, bulls on the "Aussie" are trying to return the rate above 89 EMA and 200 EMA, as well as the red line of the Tenkan Ichimoku indicator. If these attempts are successful, the pair will rise to the blue Kijun line, which lies at the level of 0.7452. However, to indicate their superiority over their opponents, a Kijun breakdown for AUD/USD bulls will be an insufficient condition. To indicate bullish sentiment on this trading instrument, it is necessary to display a quote up from the Ichimoku indicator cloud, with a preliminary passage of the most important psychological and technical level of 0.7500, as well as with an indispensable breakdown of the resistance level of 0.7558 and 50 simple moving average, which is located near this mark. It is the resistance level of 0.7558 that is the key at the moment. Bears on this trading instrument simply need to bring the price down from the Ichimoku indicator cloud, followed by a breakdown of the 0.7279 support level, where the minimum values of the last trading week were shown. To summarize the consideration of the weekly schedule. Then the situation for determining the further direction of the course seems to be quite controversial - ambiguous.
Daily

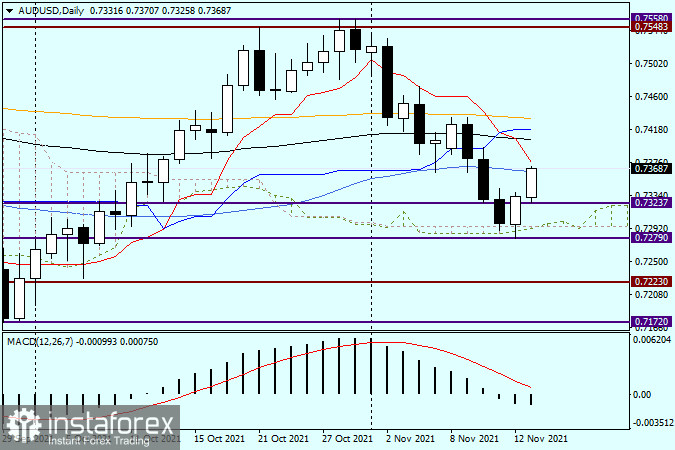
On the daily AUD/USD chart, I once again suggest paying attention that one candle closed below a certain line, and in this case, the support level of 0.7323, may not be enough to consider the breakdown true. That's exactly what happened with the 0.7323 mark. The very next day, as a result of the growth, the pair returned above the marked level, signaling its false breakdown. Today, at the end of the article, the upward movement of the Australian dollar continues. Right now, the AUD/USD pair is testing for a breakdown of 50 MA, the closing of daily trading above which will undoubtedly strengthen bullish sentiment on this trading instrument. However, the true breakdown of the Tenkan red line of the Ichimoku indicator will further indicate the supremacy of the bulls over the pair. Since the current situation is ambiguous, the pair is growing, but it is trading under strong resistances, in the form of 50 MA and the Tenkan line, I recommend taking a break for now and seeing who will take it. I do not exclude that this week we will return to the analysis of this currency pair. The technical picture for opening positions may become clearer. In the meantime, I suggest taking a wait-and-see position, or in other words, staying out of the market for AUD/USD.
 English
 Русский
 Bahasa Indonesia
 Bahasa Malay
 ไทย
ไทย Español
 Deutsch
 Български
 Français
 Tiếng Việt
 中文
中文 বাংলা
বাংলা हिन्दी
 Čeština
 Українська
 Română

