EUR/USD

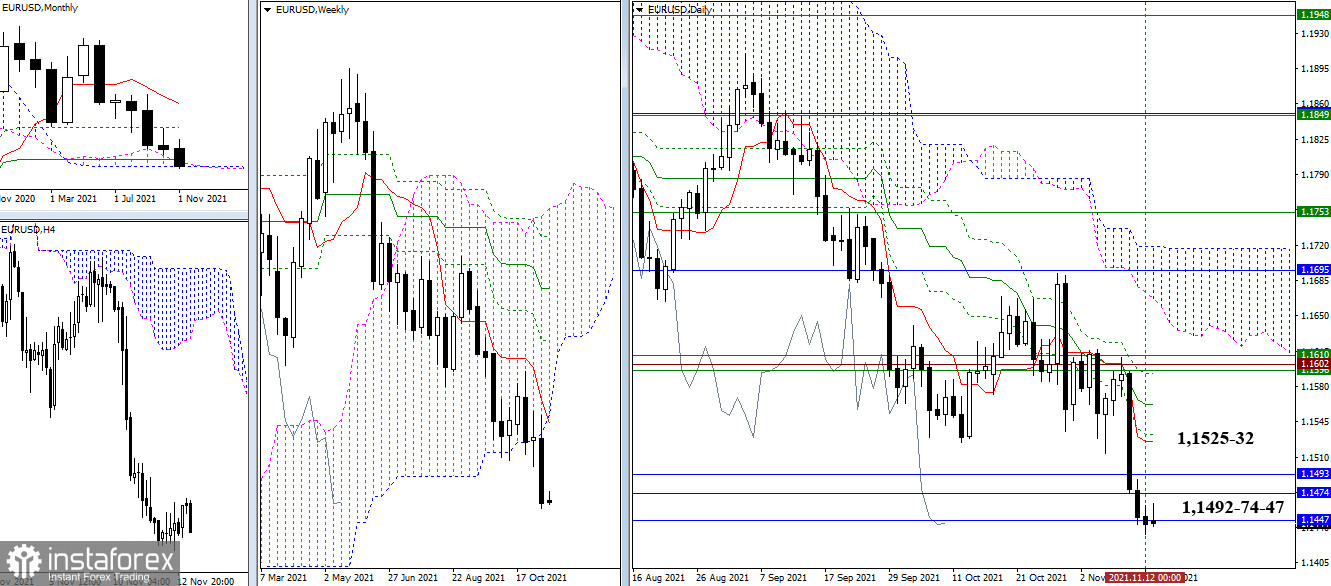
Last week, the pair moved away from the weekly cloud and declined to the accumulation of monthly support levels in the 1.1492 - 1.1474 - 1.1447 area (monthly Ichimoku cloud + monthly medium-term trend). The encountered support levels have the strength and significance that are capable of determining further options to develop the events, so now, the result of the current interaction is important to identify future prospects.

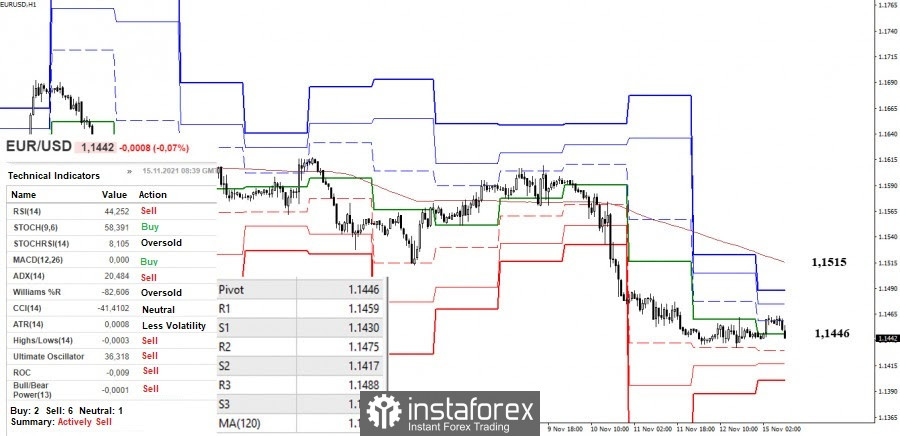
The meeting of the fortified support zone in the higher timeframes formed a slowdown in the lower timeframes. The central pivot level (1.1446) is now providing attraction. Meanwhile, the classic pivot levels serve as resistances towards the next key level in the smaller intervals – the weekly long-term trend (1.1515) (1.1459 - 1.1475 - 1.1488 ). The supports of the classic pivot levels, which are the downward pivot points, are located at 1.1430 - 1.1417 - 1.1401 today.
GBP/USD

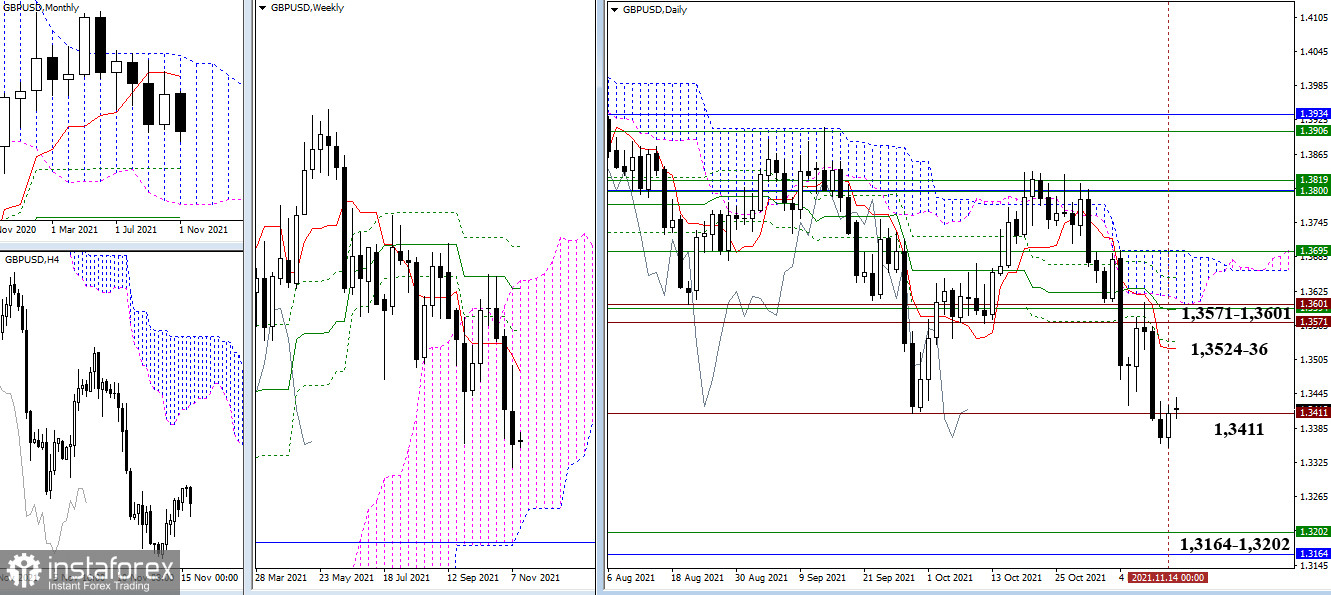
Last week, the pair tested the previous minimum extreme (1.3411) and indicated a slowdown in this area. The further development of events now depends on the result of interaction with this border. The breakdown and consolidation below will allow us to decline to the next downward pivot points. They are the lower limit of the weekly cloud (1.3202) and the monthly Fibo Kijun (1.3164). But when forming a rebound and restoring bullish positions, the benchmarks can be considered at 1.3524-36 (daily levels) and 1.3571 - 1.3601 (historical levels + weekly short-term trend).

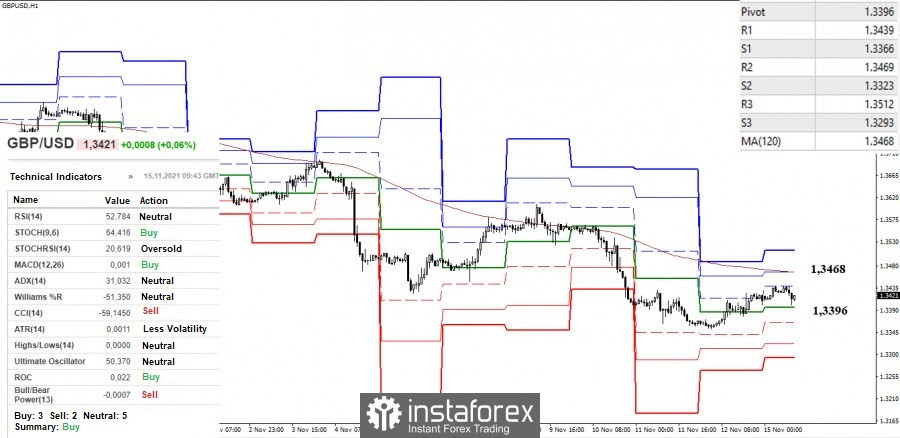
An upward correction is developing in the smaller timeframes. The bulls were able to break through the central pivot level (1.3396), which can now be used as support. The main pivot point for the correction is the weekly long-term trend (1.3468). A consolidation above and reversal of moving averages can change the current balance of forces. The third resistance (1.3512) and support for the classic pivot levels (1.3366 - 1.3323 - 1.3293) can also be noted as intraday pivot points today.
***
Ichimoku Kinko Hyo (9.26.52) and Kijun-sen levels in the higher time frames, as well as classic Pivot Points and Moving Average (120) on the H1 chart, are used in the technical analysis of the trading instruments.
 English
 Русский
 Bahasa Indonesia
 Bahasa Malay
 ไทย
ไทย Español
 Deutsch
 Български
 Français
 Tiếng Việt
 中文
中文 বাংলা
বাংলা हिन्दी
 Čeština
 Українська
 Română

