Greetings, dear traders!
Last week, the US dollar strengthened across the board. The pound sterling failed to regain ground. It declined against the US dollar during the trading sessions held on October 8-12. The greenback soared following the inflation report, which showed a surge in inflation by 6.2% in October. This is the highest level since 1990. This data has once again confirmed that the Fed's statements about temporary inflation are not correct. This is why investors are widely expecting the regulator to tighten monetary policy.
At the November meeting, the central bank announced the tapering of the quantitative easing (QE) program. However, this may not be sufficient to curb growing inflation. Thus, market participants believe that the Fed may hike the interest rate earlier than planned. According to the forecasts of some of the largest commercial banks, the first increase in the key rate may occur as early as the first half of next year or closer to the summer of 2022. Currently, the interest rate remains in the range of 0.00-0.25%. Time will show whether these predictions are correct. Let's look at the chart of the GBP/USD pair. Given that the trading week closed on Friday, then we will start the technical analysis with the corresponding timeframe.
Weekly

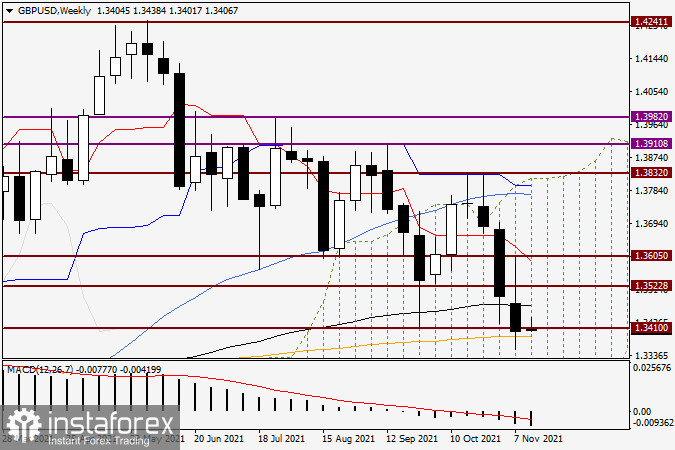
On the weekly chart, there are both bearish and bullish signals. The first ones are the short positions closed on November 8-12 below the black 89 exponential moving average, as well as the support level of 1.3410. The chart clearly shows that both the 89 EMA and the 1.3410 support have prevented the downward scenario for quite a long time, giving the pair a powerful boost. Yet, we can now see bulls' attempts to regain ground. The closing price of last week turned out to be slightly above the important level of 1.3400. The orange 200 exponential moving average passes at 1.3387. As the lows of last week were located at 1.3351 and the closing price was 1.3402, we should pay attention to the support provided by the 200 exponential moving average. Nevertheless, if we analyze the weekly chart of the pound/dollar pair, then a father decline looks likely.
Daily

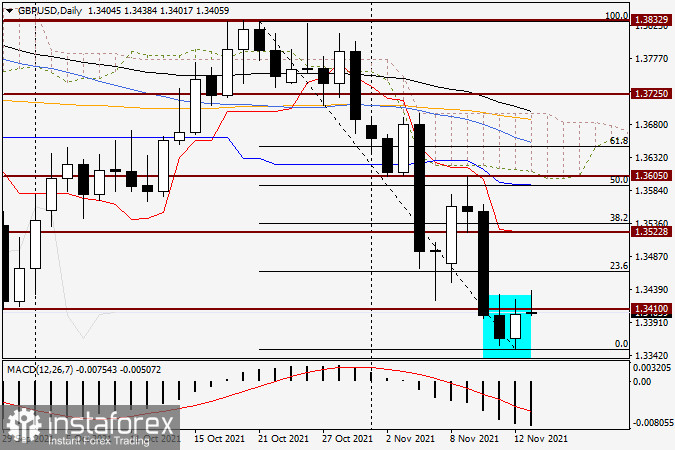
On the daily chart, it is crucial to take into account Friday's bullish (white) candlesticks, which may single a corrective pullback. If the upward movement continues, it is recommended to pay attention to the price zones of 1.3430-1.3465 and 1.3480-1.3520. If reversal patterns of candlestick analysis appear in the indicated area on the daily or smaller time frames, we will see sell signals This is the main scenario for the pair now. In tomorrow's analysis of GBP/USD, we will look at smaller charts of this pair. Today, it is better to open short positions after a corrective pullback to the indicated price zones.
Good luck!
 English
 Русский
 Bahasa Indonesia
 Bahasa Malay
 ไทย
ไทย Español
 Deutsch
 Български
 Français
 Tiếng Việt
 中文
中文 বাংলা
বাংলা हिन्दी
 Čeština
 Українська
 Română

