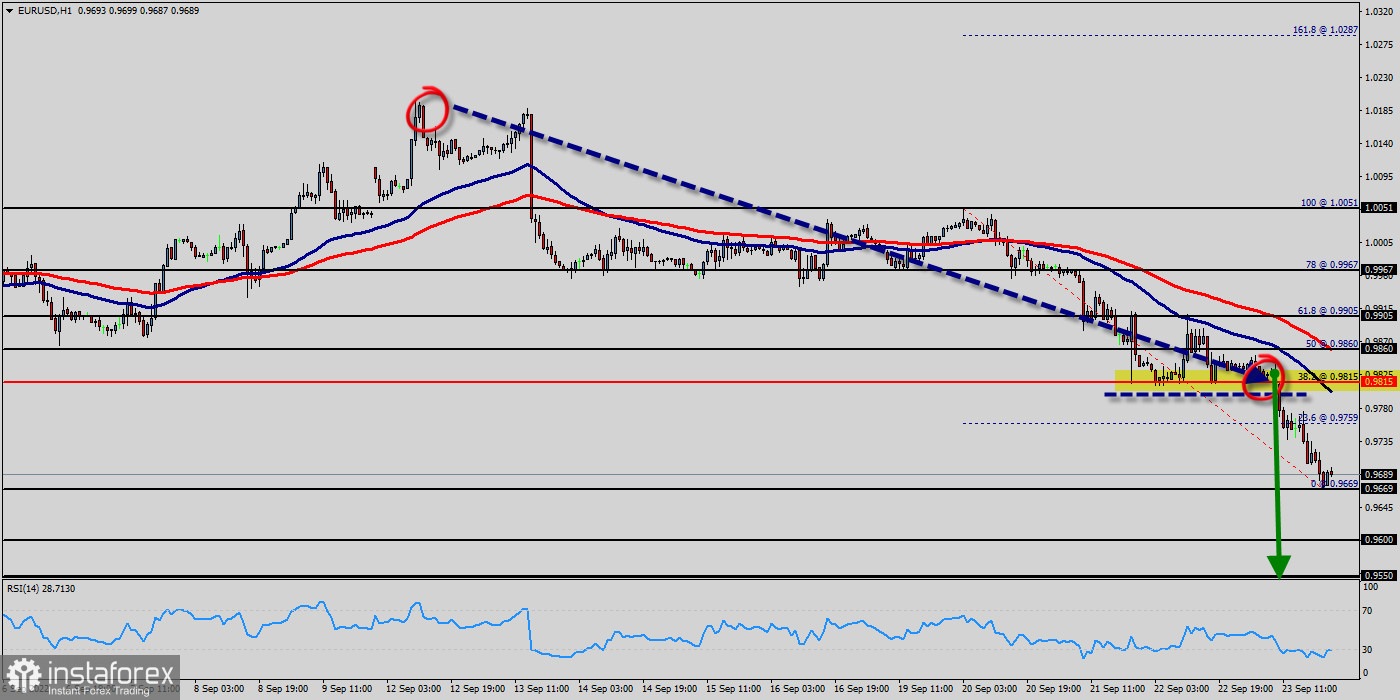
It expected the level at 0.9815 might act as resistance in the EUR/USD currency pair last week, as it had acted previously as both support and resistance. Note how these role reversal levels can work well. The H1 price chart below shows how the price rejected this level at the start of last week with a bearish inside candlestick, marked by the down arrow signaling the timing of the bearish rejection.
The EUR/USD pair faced strong resistances at the levels of 0.9815 because support had become resistance on Sept. 24, 2022. The strong resistance already formed at the level of 0.9815 and the pair is likely to try to approach it in order to test it again. However, if the pair fails to pass through the level of 0.9815, the market will indicate a bearish opportunity below the new strong resistance level of 0.9815 (the level of 0.9815 coincides with a ratio of 38.2% Fibonacci).
The EUR/USD pair was trading lower and closed the day in the red zone near the price of 0.9815. Today it was trading in a narrow range of 0.9689, staying close to Friday's closing price. On the hourly chart, the EUR/USD pair is again trading below the MA (100) H1 moving average line (0.9815).
Also, the level of 0.9815 represents a weekly pivot point for that it is acting as major resistance/support this week.
The one-hour chart favors a downward extension, as the pair broke below its 50 and 100 EMAs, both gaining downward traction. Technical indicators head sharply lower within negative levels, reflecting sellers' strength from the levels of 0.9815, 0.9860 and 0.9905.
The situation is similar on the one-hour chart. On the downside, break of 0.9669 minor support will argue that larger down trend is ready to resume. Intraday bias will be back to the downside for retesting 0.9600 low first. For now, outlook will stay bearish as long as 0.9815 support turned resistance holds, even in case of another rise.
Intraday bias in the EUR/USD pair remains downwards first. on the downside, break of 0.9600 will suggest that rebound from 0.9550 has completed.
Moreover, the RSI starts signaling a downward trend, as the trend is still showing strength below the moving average (100) and (50). An alternative scenario is a final consolidation below MA 100 H1, followed by growth to 0.9815.
The market is indicating a bearish opportunity below the above-mentioned support levels, for that the bullish outlook remains the same as long as the 100 EMA is headed to the downside.
This is typically a great time of day to be entering trades in major Forex currency pairs especially anything involving an European currency such as the Euro. This trade has been nicely profitable, achieving a maximum positive reward to risk ratio of more than 6 to 1 based upon the size of the entry candlestick structure.
An acceleration in the bearish trend on the EUR/USD pair, which is a positive signal for sellers. As long as the price remains below the price of 0.9815 a sale could be considered. The first bearish objective is located at 0.9600.
On the other hand, the stop loss should always be taken into account, for that it will be reasonable to set your stop loss at the level of 0.9860. In the very short term the general bullish sentiment is confirmed by technical indicators. Therefore, a small upwards rebound in the very short term could occur in case of excessive bearish movements. But the market is still in an downtrend. We still prefer the bearish scenario.
 English
 Русский
 Bahasa Indonesia
 Bahasa Malay
 ไทย
ไทย Español
 Deutsch
 Български
 Français
 Tiếng Việt
 中文
中文 বাংলা
বাংলা हिन्दी
 Čeština
 Українська
 Română

