USD/CHF Triangle Pattern!
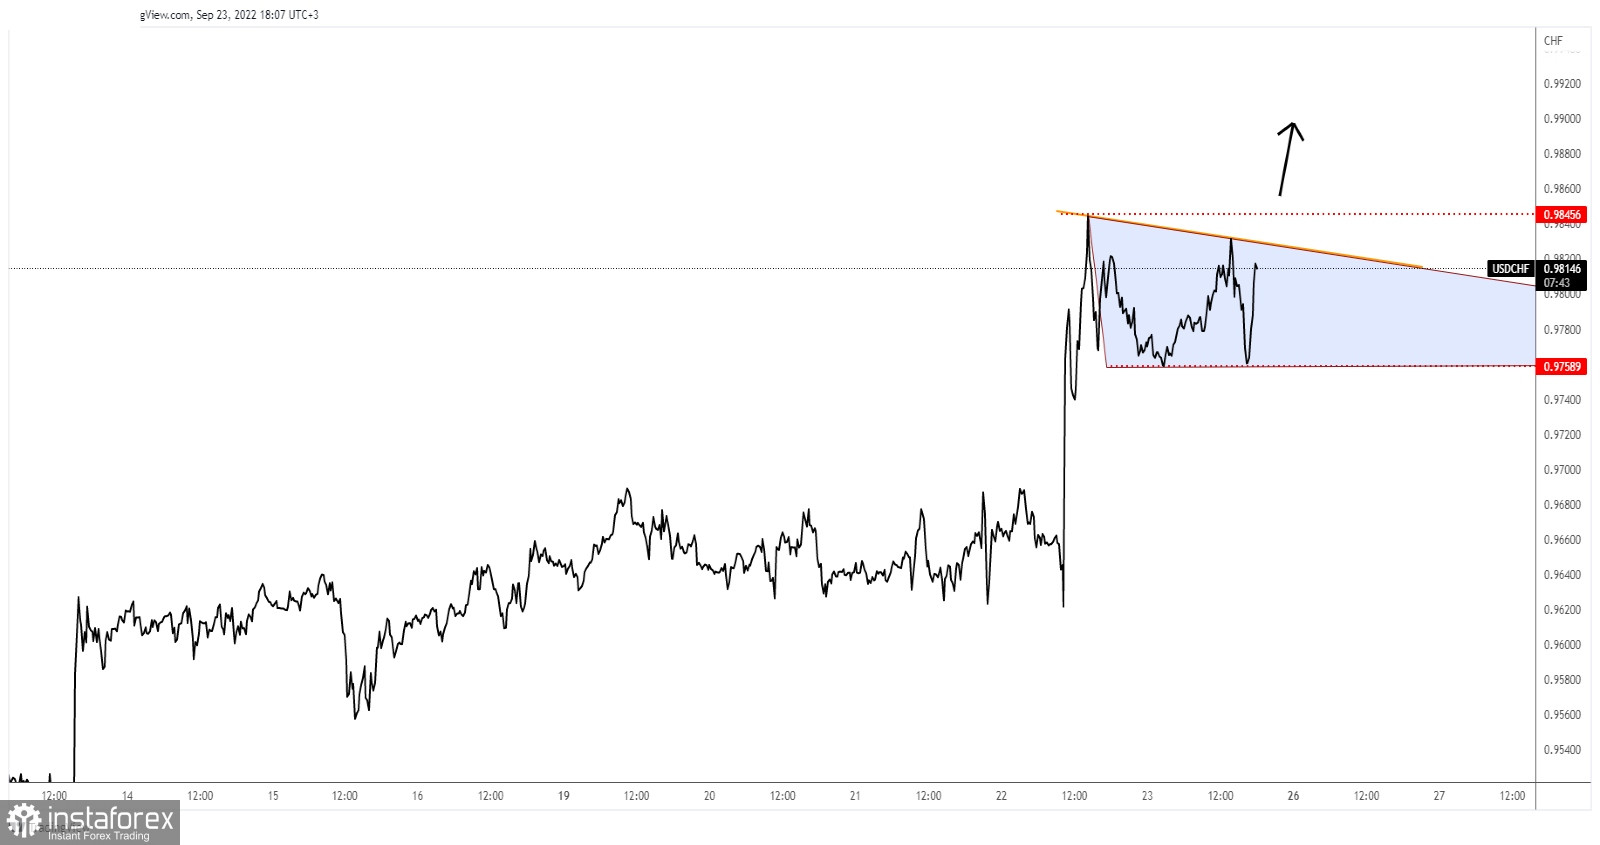
The USD/CHF pair was trading at the 0.9816 level at the time of writing. As you can see on the H1 chart, the price has been moving sideways between 0.9758 and 0.9845. After its strong upside movement, the current range is natural as the price tries to attract more buyers before resuming its growth.
The price action developed a triangle pattern as well. Escaping from this pattern could bring us new trading opportunities. The triangle's upside line and the 0.9845 represent upside obstacles.
USD/CHF Trading Conclusion!
Jumping and stabilizing above the 0.9845 obstacles may confirm further growth and helps the buyers to catch a buying opportunity.
 English
 Русский
 Bahasa Indonesia
 Bahasa Malay
 ไทย
ไทย Español
 Deutsch
 Български
 Français
 Tiếng Việt
 中文
中文 বাংলা
বাংলা हिन्दी
 Čeština
 Українська
 Română

