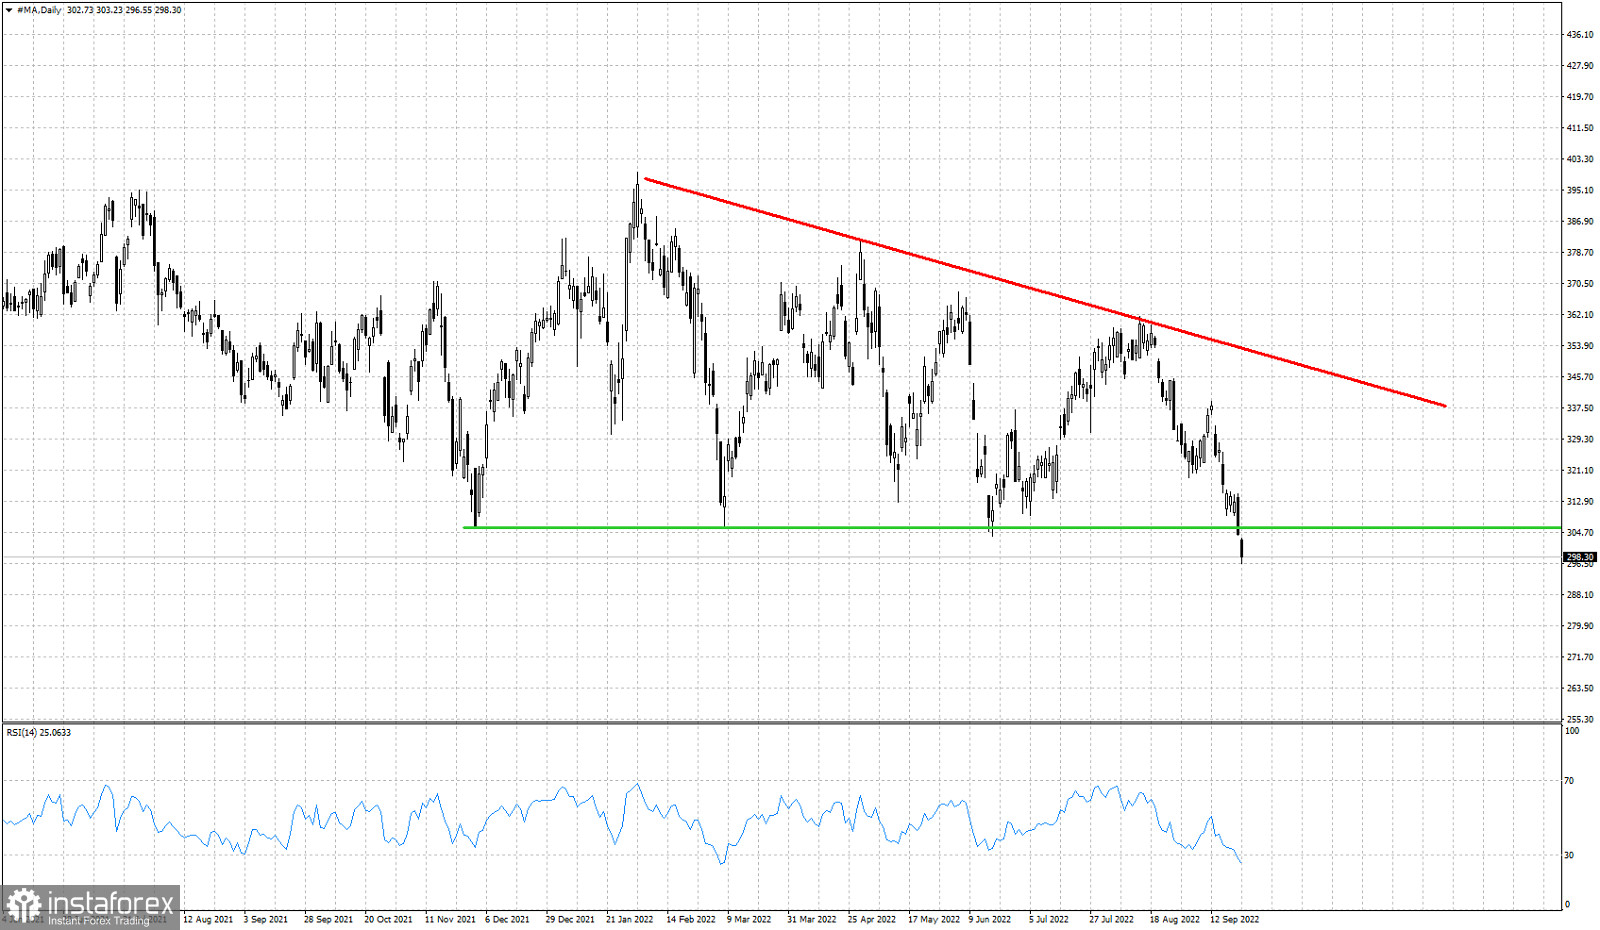
Red line -resistance
Green line- support (broken)
In our recent analysis we saw MA stock price get rejected and we warned that a pull back from $365 to $300-$310 was imminent. Today price is breaking below the important horizontal support and is trading below $300. Price has gapped down today to $292 and unless we see as swift recovery above $306, bulls will be in trouble. Breaking below a support level that was tested 3 times before is not good news. The descending triangle pattern is getting confirmed. The RSI in the daily chart is at oversold levels. However there is no bullish divergence. This implies that any bounce should be considered as a selling opportunity. Previous support at $305-$310, is now resistance.
 English
 Русский
 Bahasa Indonesia
 Bahasa Malay
 ไทย
ไทย Español
 Deutsch
 Български
 Français
 Tiếng Việt
 中文
中文 বাংলা
বাংলা हिन्दी
 Čeština
 Українська
 Română

