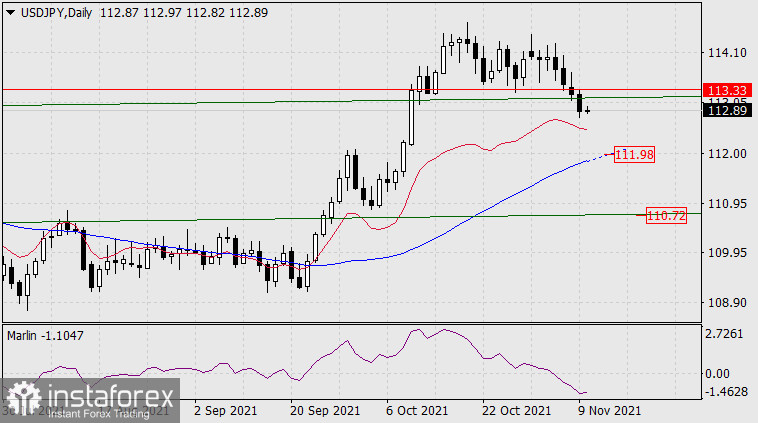
Yesterday, a significant event took place for the USD/JPY pair - the price broke through the support of the trend line of the price channel of the weekly timeframe (113.13) and, obviously, outlined a further decline towards the 111.98 target - to the MACD line on the daily chart. Overcoming this support will open the target along the lower line of the price channel at 110.72.

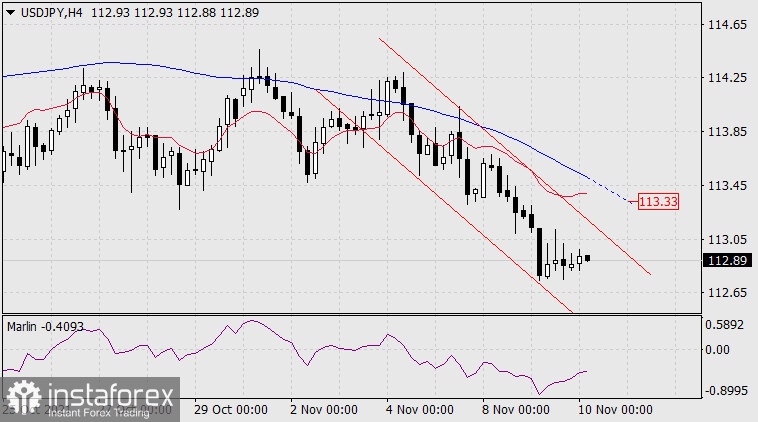
On a four-hour chart, the price is decreasing in a narrow price channel, at the moment the price is approaching its upper border, from which we expect a downward reversal. The Marlin Oscillator is growing in the negative area, which in the current conditions means the oscillator is discharging from the oversold zone before the subsequent decline.

To break the current trend, the price needs to go above the MACD indicator line, above 113.33, that is, above the price channel line on the daily chart.
 English
 Русский
 Bahasa Indonesia
 Bahasa Malay
 ไทย
ไทย Español
 Deutsch
 Български
 Français
 Tiếng Việt
 中文
中文 বাংলা
বাংলা हिन्दी
 Čeština
 Українська
 Română

