To open long positions on EURUSD, you need:
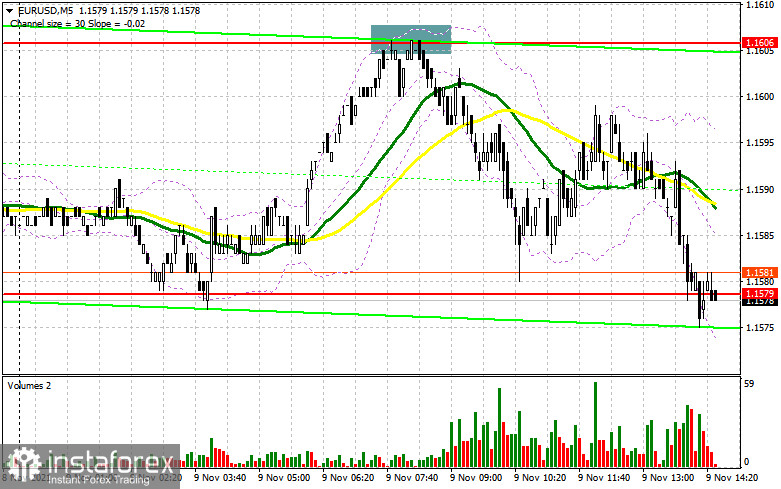
In my morning forecast, I paid attention to the level of 1.1606 and recommended making decisions on entering the market. Let's look at the 5-minute chart and figure out the entry point. On the one hand, good data on the indicator of the assessment of sentiment in the business environment of Germany and the eurozone supported the euro. On the other hand, with a more detailed examination of the indicator, a sharp reduction in the current situation did not allow buyers to break above 1.1606. As a result, a false breakdown was formed and a signal to open short positions, which led to the movement of the euro down to the support area of 1.1579. From a technical point of view, nothing has changed, and the strategy remains the same.

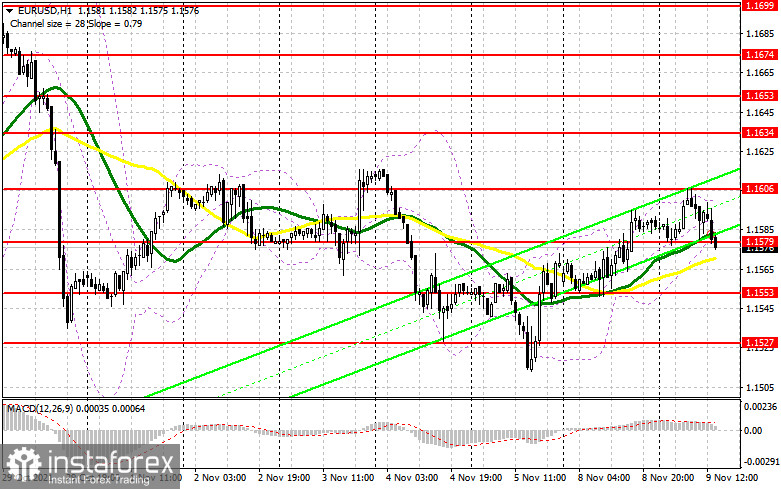
The focus has shifted only to the speeches of representatives of the Federal Reserve System, as well as to the interview of the chairman of the central bank Jerome Powell, which may lead to a surge in volatility and a return to the area of 1.1606. Only going beyond this level with a reverse test from top to bottom will give an entry point into long positions with the aim of EUR/USD growth to the area of 1.1634, where I recommend fixing the profits. The breakthrough of this range will depend entirely on the statements of the central bank's politicians since the publication of important fundamental statistics is not scheduled for the afternoon. The 1.1634 test from top to bottom will lead to an additional buy signal and a return of EUR/USD to the area of a new high of 1.1654, where I also recommend fixing the profits. If the pressure on the pair persists, only the formation of a false breakdown in the area of 1.1579, where the moving averages are already playing on the buyers' side, will give an excellent signal to buy the euro with the aim of an upward correction. In the absence of an activity scenario at 1.1579, it is best to wait for the formation of a false breakdown in the area of 1.1553, but it is possible to open long positions in EUR/USD immediately for a rebound from the minimum of 1.1527, counting on a correction of 15-20 points inside the day.
To open short positions on EURUSD, you need:
Sellers managed to protect the very important resistance of 1.1606 and now they will fully focus on breaking through the support of 1.1579, which was formed following the results of yesterday. Only hawkish statements by representatives of the Federal Reserve System on the topic of monetary policy, as well as a breakthrough and an update of 1.1579 from the bottom up will lead to the formation of a good entry point into short positions in the continuation of the EUR/USD decline to a minimum of 1.1553. But even updating this range will not put an end to the upward correction of the euro. Bears need a similar breakdown and a bottom-up test of 1.1553. Only such a scenario will collapse the pair already to the lows of 1.1527 and open the way to the area of 1.1494. In the scenario of an upward correction of EUR/USD, only the next formation of a false breakdown at 1.1606, together with soft statements by Federal Reserve System politicians, will lead to the formation of a signal to sell the euro to implement the above scenario. If the pair grows in the second half of the day and there are no sellers at the level of 1.1606, it is best to postpone sales until the test of the maximum of 1.1634. It is possible to open short positions immediately for a rebound based on a downward correction of 15-20 points from a large resistance of 1.1653.

The COT report (Commitment of Traders) for November 2 recorded a reduction in both short and long positions, which led to a slight recovery of the negative delta, as more sellers left the market than buyers. The meetings of central banks, which last week fueled the markets, did not lead to significant changes, as the specific policy of the Federal Reserve System regarding measures to support the economy allowed investors to remain optimistic and believe in the continuation of the economic recovery. However, expectations that the European Central Bank, despite all its statements, will also be forced to resort to measures to tighten its policy in the near future due to high inflation, leave a chance for buyers of the euro to restore the trading instrument in the medium term. This leads to the fact that with each significant decline in the European currency, the demand for it returns quite actively. In the near future, we will get acquainted with important data on inflation in the United States, which will determine the future direction of the US dollar against several other world currencies. The COT report indicates that long non-commercial positions decreased from the level of 196,880 to the level of 191,496, while short non-commercial positions fell from the level of 208,136 to the level of 197,634. At the end of the week, the total non-commercial net position recovered slightly and amounted to -6,388 against -11,256. The weekly closing price decreased quite slightly, to the level of 1.1599 against 1.1608.
Signals of indicators:
Moving averages
Trading is conducted above 30 and 50 daily moving averages, which indicates an attempt by the bulls to maintain an upward correction.
Note: The period and prices of moving averages are considered by the author on the hourly chart H1 and differ from the general definition of the classic daily moving averages on the daily chart D1.
Bollinger Bands
A breakthrough of the lower limit of the indicator in the area of 1.1570 will lead to an instant fall of the euro. A break of the upper limit in the area of 1.1590 will lead to new growth of the pair.
Description of indicators
- Moving average (moving average determines the current trend by smoothing out volatility and noise). Period 50. The graph is marked in yellow.
- Moving average (moving average determines the current trend by smoothing out volatility and noise). Period 30. The graph is marked in green.
- MACD indicator (Moving Average Convergence / Divergence - moving average convergence/divergence) Fast EMA period 12. Slow EMA period 26. SMA period 9
- Bollinger Bands (Bollinger Bands). Period 20
- Non-profit speculative traders, such as individual traders, hedge funds, and large institutions that use the futures market for speculative purposes and meet certain requirements.
- Long non-commercial positions represent the total long open position of non-commercial traders.
- Short non-commercial positions represent the total short open position of non-commercial traders.
- Total non-commercial net position is the difference between the short and long positions of non-commercial traders.
 English
 Русский
 Bahasa Indonesia
 Bahasa Malay
 ไทย
ไทย Español
 Deutsch
 Български
 Français
 Tiếng Việt
 中文
中文 বাংলা
বাংলা हिन्दी
 Čeština
 Українська
 Română

