GBP/USD 5M

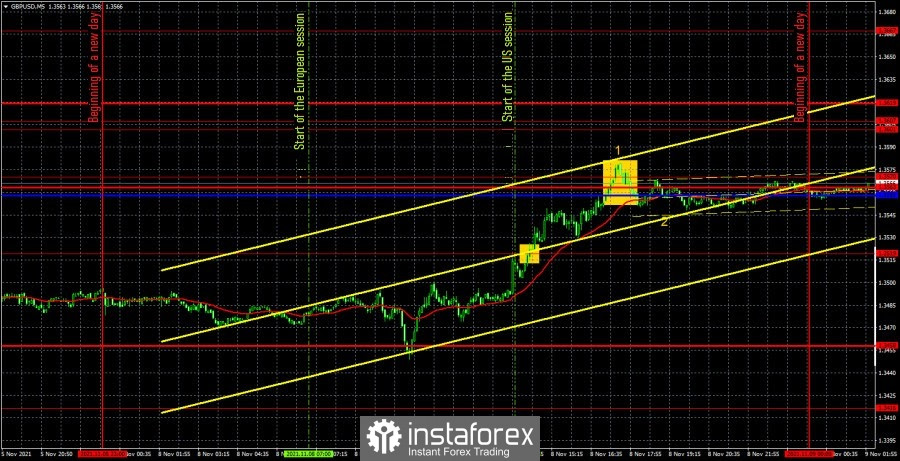
The GBP/USD pair traded much better than the EUR/USD pair on November 8. First, there was a trending move for most of the day. Secondly, the volatility was not the highest, but still very decent - 130 points. Thus, it was a sin not to try to work out such a movement. Moreover, at the weekend we said that the pound would seek to rise due to the fact that last week's fall absolutely does not correspond to the fundamental background, especially from the UK. Thus, we are waiting not just for the British currency to grow by 130 points, but for a much larger upward movement. Unfortunately, there was not a single important line or extreme level in the area where the upward movement started on Monday. Thus, it was not possible to "catch" this movement from its very beginning. Nevertheless, it was possible to open long positions on the buy signal in the form of a breakthrough of the 1.3519 level. Subsequently, the price reached the Kijun-sen line, the resistance level of 1.3563 and the extreme level of 1.3570. All these lines and levels should be considered as a single area. And the price eventually rebounded from it, so it was necessary to take profit on long positions, which amounted to about 20 points. Yes, it's not much, but Monday was, in principle, not the most successful day. It was no longer necessary to work out a sell signal, since it was formed when Federal Reserve Chairman Jerome Powell's speech began (the figure "1" in the chart). And about an hour later, Bank of England Governor Andrew Bailey's speech began (the figure "2" in the chart). Both did not give anything new to the markets, however, these were potentially important events.
GBP/USD 1H

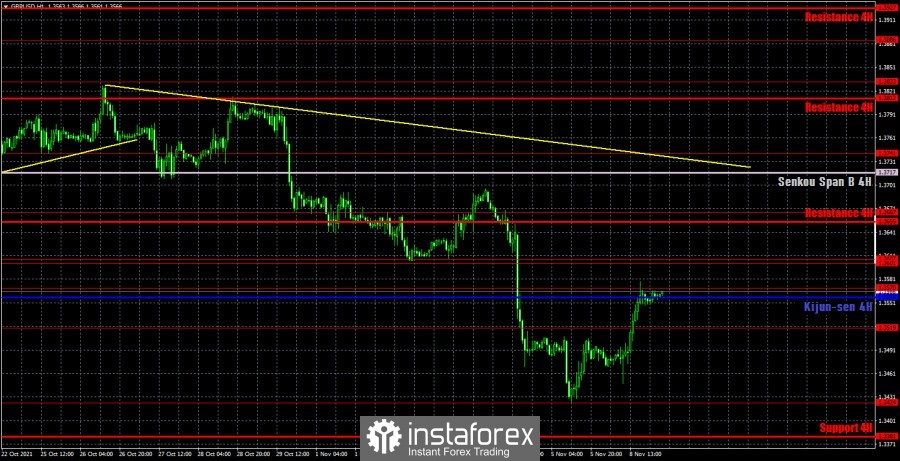
The pound/dollar pair maintains a downward trend on the hourly timeframe, however, we have already drawn traders' attention to the fact that the downward trend line is extremely weak, and has a very weak slope angle. Thus, almost any upward movement in strength can fit into the framework of a downward trend. At the moment, the pound's quotes have managed to rise to the critical line. We believe that the upward movement will continue at least to the trend line. We highlight the following important levels on November 9: 1,3424, 1,3519, 1,3570, 1,3601 – 1,3607, 1,3667. The Senkou Span B (1.3717) and Kijun-sen (1.3558) lines can also be signal sources. It is recommended to set the Stop Loss level to breakeven when the price passes in the right direction by 20 points. The lines of the Ichimoku indicator can move during the day, which should be taken into account when searching for trading signals. Central bankers Bailey and Powell will speak in the UK and the US on Tuesday. However, these events may also not cause any reaction from the markets. Simply because last week there were meetings of both central banks, during the summing up of which both Bailey and Powell spoke. Therefore, it is unlikely that in less than a week, both heads will be able to surprise the markets with something. Moreover, they were not surprised by anything on Monday...
We recommend you to familiarize yourself:
Overview of the EUR/USD pair. November 9. The dollar is trying to continue growing, but this is not beneficial to the Fed
Overview of the GBP/USD pair. November 9. The Bank of England may support the pound, while it may rise by 500 points
Forecast and trading signals for EUR/USD for November 9. Detailed analysis of the movement of the pair and trade deals.
COT report

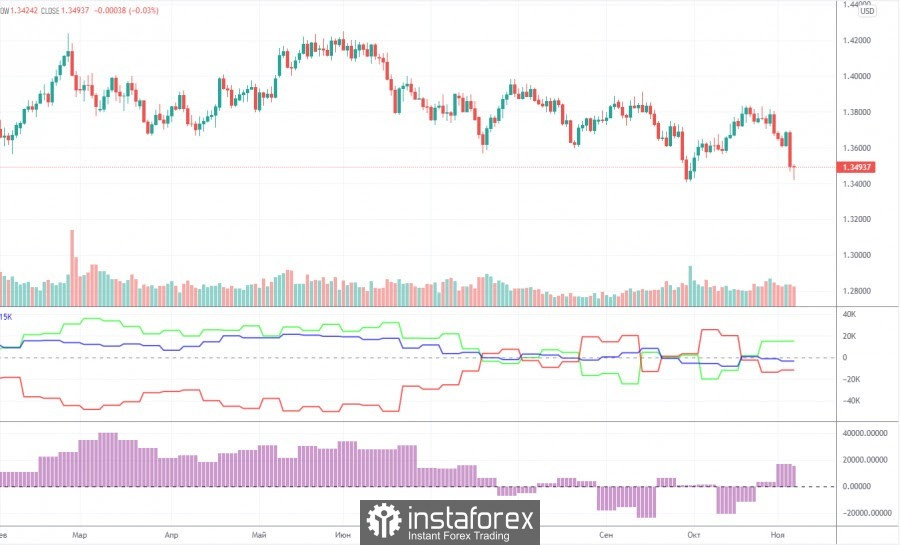
The mood of professional traders practically did not change during the last reporting week (October 26-November 1). However, it should be noted that the two most important days of last week – Wednesday and Thursday - when all the strongest movements occurred, were not included in the latest report. That is, in a week we will be able to see how much and in which direction the mood of professional traders has changed. In the meantime, we can only draw the same conclusions as a week ago. The green and red lines of the first indicator continue to constantly change the direction of movement, constantly intersecting. This suggests that big players themselves do not understand what to do with the pound. However, this can be clearly seen from the very schedule of the pair's movement, starting from July. These four months, the pound/dollar pair has been between the levels of 1.3400 and 1.4000, that is, in the horizontal channel. It was during this period of time that commercial and non-commercial traders changed their mood almost every week. Thus, taking into account the previous changes, we would assume that a new growth of the British currency will begin in the near future with the prospect of a 500-point rise. Moreover, the results of the Bank of England meeting were not dovish. The British currency has fallen undeservedly, which means that the markets may soon recoup this injustice. It should also be noted that during the reporting week, professional traders opened 5.8 buy contracts (longs) and 7.5 thousand sell contracts (shorts). Thus, the net position has not changed much.
Explanations for the chart:
Support and Resistance Levels are the levels that serve as targets when buying or selling the pair. You can place Take Profit near these levels.
Kijun-sen and Senkou Span B lines are lines of the Ichimoku indicator transferred to the hourly timeframe from the 4-hour one.
Support and resistance areas are areas from which the price has repeatedly rebounded off.
Yellow lines are trend lines, trend channels and any other technical patterns.
Indicator 1 on the COT charts is the size of the net position of each category of traders.
Indicator 2 on the COT charts is the size of the net position for the non-commercial group.
 English
 Русский
 Bahasa Indonesia
 Bahasa Malay
 ไทย
ไทย Español
 Deutsch
 Български
 Français
 Tiếng Việt
 中文
中文 বাংলা
বাংলা हिन्दी
 Čeština
 Українська
 Română

