In this review, we will consider the technical picture on the weekly and daily timeframes. For now, we will make general assumptions about the possible direction of movement of the pound/dollar currency pair. However, before that, about market sentiment, which switched to who will become the next head of the US Federal Reserve System (FRS). In order not to repeat me, you can read more about this in today's euro/dollar review. Let me also remind you once again that the main event of today will be the speech of the current Chairman of the Fed, Jerome Powell, which is scheduled for 16:30 London time. And we begin the analysis of the technical picture with a weekly timeframe. I will try to state my thoughts briefly and concretely enough so as not to take up too much time from you.
Weekly

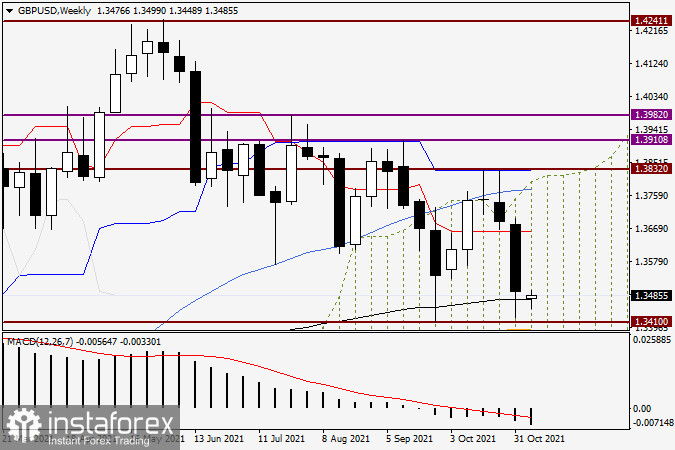
So, last week, the GBP/USD currency pair showed a rather impressive decline, closing trading on November 1-5 at 1.3496. I dare to assume that the closing price below the iconic psychological level of 1.3500 complicates the prospects of an upward scenario. This is on the one hand. On the other hand, the bears on the pound failed to break through the black 89-exponential moving average, as well as the key support level at this stage of time, 1.3410. As can be seen on the graph, the 89-EMA is no stranger to repelling players' attacks on the rate increase. The nearest weekly resistance can be considered the red Tenkan line of the Ichimoku indicator, which runs at 1.3661. If we also consider that at this stage of time, the pair is trading approximately in the middle of the Ichimoku cloud, I would not rule out both scenarios.
Daily

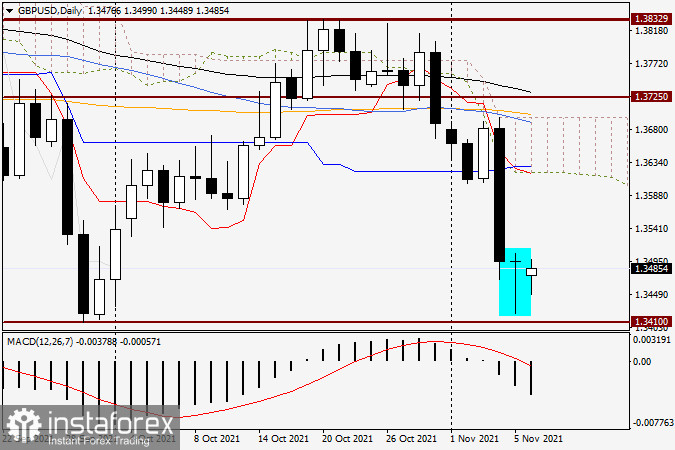
But on the daily price chart, there is a slightly different picture, which is based primarily on candlestick patterns. After the crushing fall of the pair on November 4, the very next day, the pound bulls came to their senses and stopped the subsequent possible collapse of the exchange rate. This is more than confirmed by the candle of the Doji variety, which appeared at the end of trading on November 5 and is circled on the chart. Of course, such a candle with a long lower shadow can be considered a reversal model. At the end of the article, there are attempts by bulls to tidy up the course of trading from their side and start correcting the course, this is at least. There can be no talk of a complete reversal of the quotation in the north direction yet.
To do this, it is necessary to return above 1.3600, and at the end of the article, trading on GBP/USD takes place close to the psychological level of 1.3500, just a few points below this mark. If today's trading closes above the 1.3500 level, there will be a good chance of continuing the upward movement. Bears on the pound in any case need to break through strong support at 1.3410 and lower the rate below 1.3400. Only in this case, the implementation of a bearish scenario is possible. At the moment, the most priority positioning looks like purchases after small and short-term corrective pullbacks down. We will talk about this in more detail in tomorrow's article when smaller time intervals will be considered.
 English
 Русский
 Bahasa Indonesia
 Bahasa Malay
 ไทย
ไทย Español
 Deutsch
 Български
 Français
 Tiếng Việt
 中文
中文 বাংলা
বাংলা हिन्दी
 Čeština
 Українська
 Română

