 English
  Русский
 Bahasa Indonesia
 Bahasa Malay
 ไทย
ไทย Español
 Deutsch
 Български
 Français
 Tiếng Việt
 中文
中文 বাংলা
বাংলা हिन्दी
 Čeština
 Українська
 Română

Trend analysis (Fig. 1).
On Monday the market from the level of 1.3496 (Friday's daily candlestick closing) may start moving upward with the target of 1.3523, a pullback level of 14.6% (yellow dotted line). Upon reaching this level, the price may continue to move upwards with the target of 1.3556, a pullback level of 23.6% (yellow dotted line).
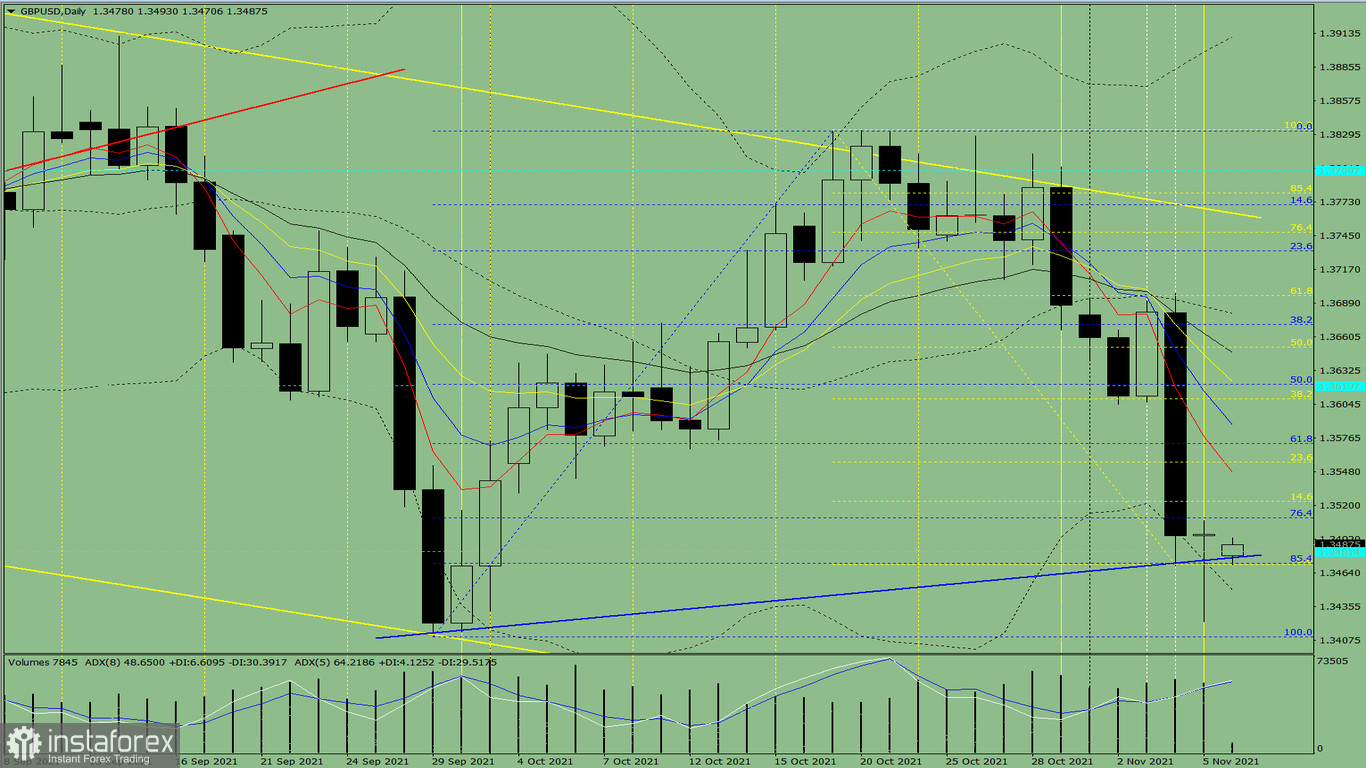
Fig. 1 (daily chart)
Comprehensive analysis:
- indicator analysis - up;
- Fibonacci levels - up;
- volumes - up;
- Candlestick pattern- up;
- trend analysis - up;
- Bollinger Bands - up;
- weekly chart - up.
Conclusion:
Today, the price from Friday's daily candlestick closing level of 1.3496 may start an upward movement with the target 1.3523, the 14.6% pullback level (yellow dotted line). Upon reaching this level, the price could continue moving upwards with a target of 1.3556, the 23.6% pullback level (yellow dotted line).
Unlikely scenario: the price from 1.3496 (Friday's daily candlestick close) could start moving downwards with the target 1.3410, lower fractal (blue dotted line). On reaching this level, the price could start moving upwards with a target of 1.3523, the 14.6% pullback level (yellow dotted line).