EUR/USD 24-hour TF analysis.

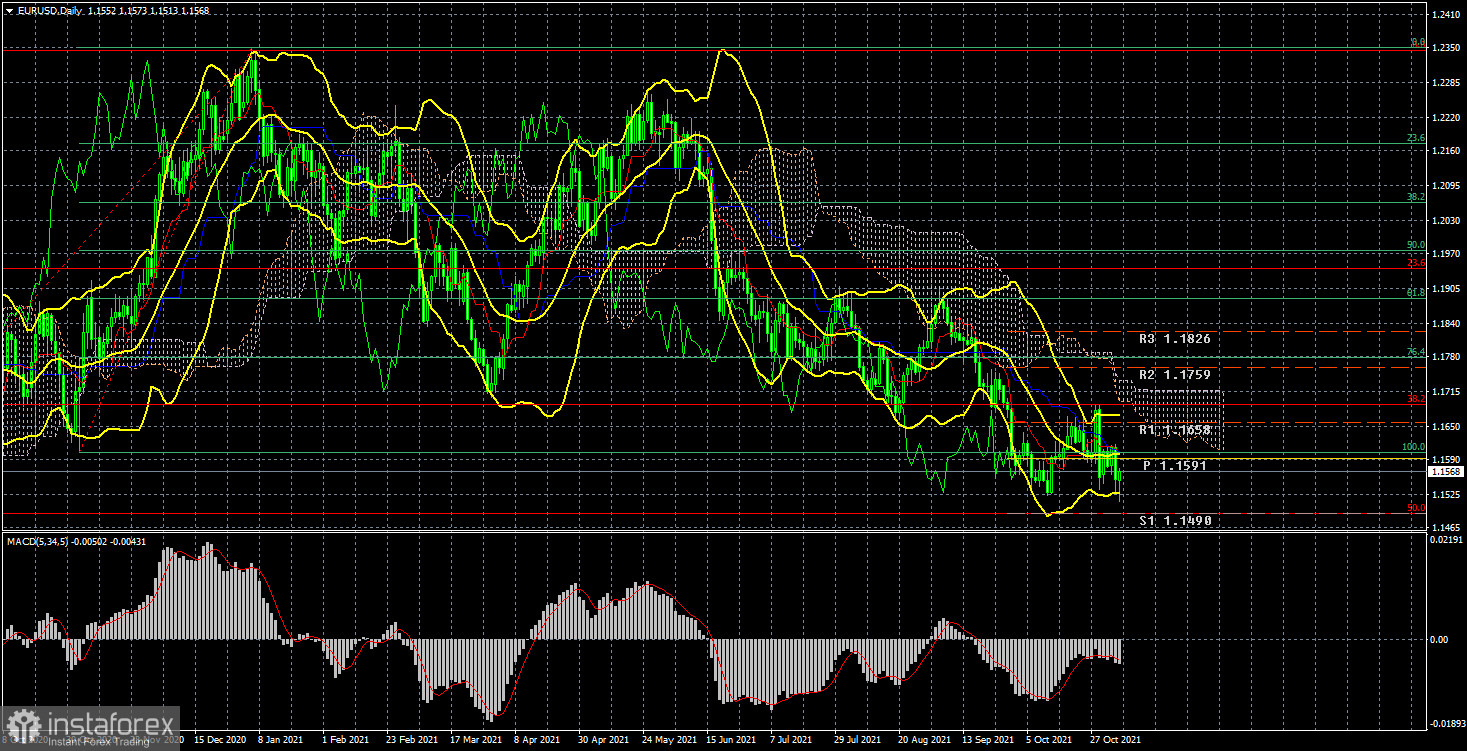
The EUR/USD currency pair during the current week as a whole did not show the volatility and the movement that was expected from it. If you look at the 24-hour timeframe, it becomes clear that the pair at the end of the week remained approximately where it started. And this is although this week the results of the Fed meeting were summed up. And this time concrete and important decisions were made, and the meeting cannot be called a "walk-through". In addition, Christine Lagarde made an important speech, and on Friday Nonfarms were published, which for the first time in three months were on top. But all this was not enough for the pair to start trading more actively. In principle, the illustration above clearly shows that the strongest movement in recent months happened last Thursday when the ECB summed up the results of its meeting. In general, the pair continues to trade near the 15th level, not far from the support level of 1.1490, which coincides with the 50.0% Fibonacci level. The downward trend continues, but the bears seem to have lost their momentum and are no longer able to move the pair further down. We remind you that all the movement in the last 10 months is still a correction against the upward trend, which is confirmed by the Fibonacci levels. Thus, since the price is still located below the Ichimoku cloud, it is not worth talking about a new upward trend now. Nevertheless, the US dollar received the support of the Fed that it was counting on, but this did not have a positive effect on its exchange rate. The markets may have long taken into account the curtailment of the quantitative stimulus program, so the prospects of the US currency remain vague.
Analysis of the COT report.

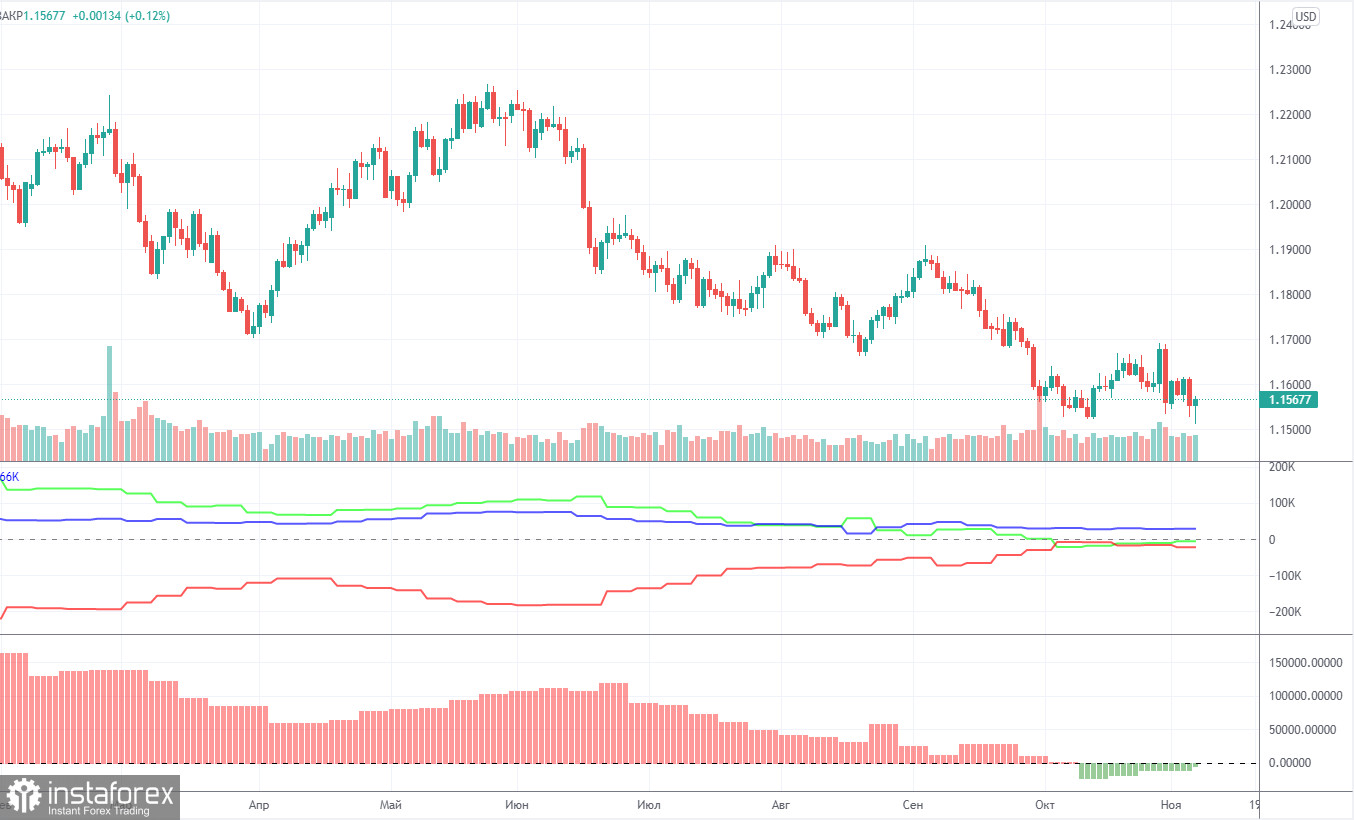
During the last reporting week (October 25-29), the mood of non-commercial traders changed. During the reporting week, a group of "Non-commercial" traders closed 4,000 contracts for purchase and 10.5 thousand contracts for sale. Consequently, the net position of professional players has grown by 6.5 thousand, which is not so much. However, the changes in the mood of non-commercial traders are best seen by the first indicator in the illustration above. The red and green lines have been moving towards each other for a long time, and in the last couple of months, they have been almost at the same level. This suggests that the previous trend is ending, and the mood of the major players at this time is as neutral as possible. This is confirmed by the data on the total number of contracts. The "Non-commercial" group has 195 thousand buy contracts and 199 thousand sell contracts. The Commercial group has 418 thousand contracts for purchase and 442 thousand contracts for sale. As we can see, the numbers are almost the same. Therefore, there are theoretical chances for the continuation of the downward movement in the pair. The trend began to end (an upward trend) when the red and green lines (net positions of the "Commercial" and "Non-commercial" groups) began to narrow. And now, logically, the downward trend continues. However, this "trend" is still not too similar to the trend. Rather, a banal three-wave correction.
Analysis of fundamental events.
There were plenty of macroeconomic and fundamental events this week. We have already covered the most important ones several times. Nevertheless, it is worth noting once again that the Fed has finally announced the curtailment of the QE program, and NonFarm Payrolls has finally exceeded experts' forecasts. After such positive news, traders could count on further strengthening the US currency. But that didn't happen. Therefore, there are more doubts that the euro/dollar pair can continue the downward movement at all. Recall that a few months ago we expected the end of the downward movement, as global fundamental factors continue to be not on the side of the dollar. However, all this time the pair continues to crawl down. Don't be confused by the scale of movements on a 24-hour timeframe. When volatility remains low for a long time, the scale of the chart increases automatically. The volatility of the pair remains low, and all the recent downward movements are only 600 points. 600 points in 10 months. Perhaps the markets have already worked out all the positives from the States and are no longer ready to continue buying the dollar.
Trading plan for the week of November 8-12:
1) On the 24-hour timeframe, the upward trend has not changed, since the bulls were saved near the first serious 38.2% Fibonacci level of 1.1691 a week earlier. At the moment, the quotes remain below the Kijun-sen line, and the markets have shown that they are not ready to buy the pair. Thus, the downward movement may continue with the target of 1.1490, to which there is very little left. But an even greater downward movement is already under great question.
2) As for purchases of the euro/dollar pair, in the current conditions, they should be considered no earlier than fixing the price above the critical line. And ideally, above the Ichimoku cloud, because the price has already overcome the Kijun-sen several times, but then could not continue to move up. There are few prerequisites for a new upward trend to begin in the near future, although the general fundamental background still indicates a very likely fall in the dollar.
Explanations to the illustrations:
Price levels of support and resistance (resistance /support), Fibonacci levels - target levels when opening purchases or sales. Take Profit levels can be placed near them.
Ichimoku indicators(standard settings), Bollinger Bands(standard settings), MACD(5, 34, 5).
Indicator 1 on the COT charts - the net position size of each category of traders.
Indicator 2 on the COT charts - the net position size for the "Non-commercial" group.
 English
 Русский
 Bahasa Indonesia
 Bahasa Malay
 ไทย
ไทย Español
 Deutsch
 Български
 Français
 Tiếng Việt
 中文
中文 বাংলা
বাংলা हिन्दी
 Čeština
 Українська
 Română

