To open long positions on GBP/USD, you need:
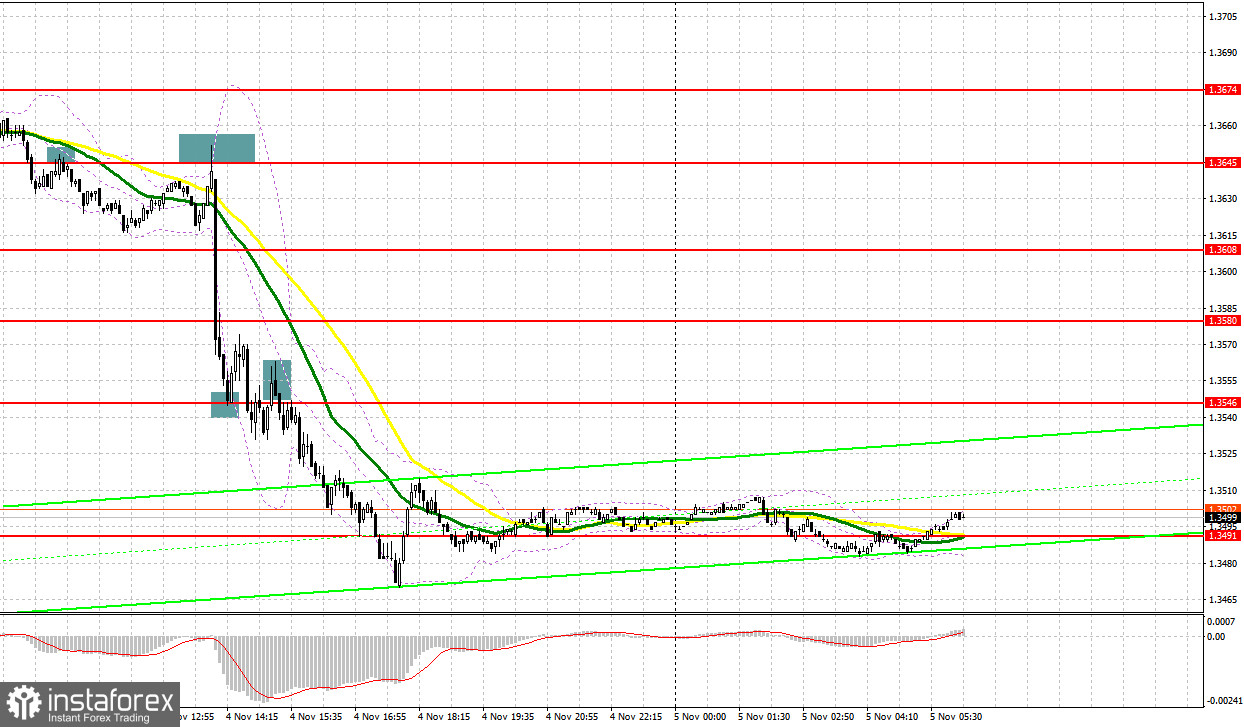
Yesterday there were many signals to enter the market to sell the pound. Let's take a look at the 5-minute chart and figure out all the entry points. In my morning forecast, I paid attention to the level of 1.3645 and advised you to make decisions on entering the market. You can clearly see how the breakthrough and reverse test of 1.3645 from the bottom up results in forming an excellent entry point into short positions. Immediately after that, the pound fell by 30 points, slightly missing the nearest support at 1.3608, which the bears will be aiming for in the afternoon. In the second half of the day, even before the Bank of England announced its decision on interest rates, a similar false breakout at 1.3645 and a signal to sell the pound are formed, which then leads to a large drop in the pair. As a result, the downward movement is limited by the level of 1.3546, from which we are observing a small upward correction. During the US session, a breakthrough and reverse test of this area provides another entry point to short positions, which leads to a fall of the pound to the 1.3491 area.

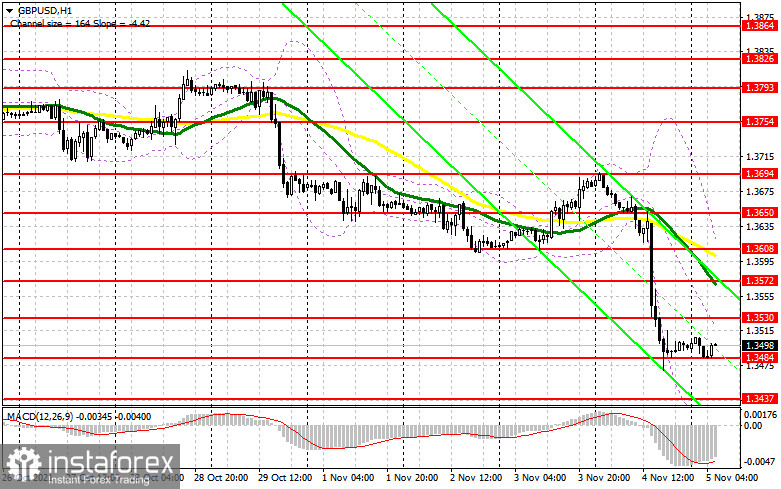
The BoE's decision to leave policy unchanged led to a sharp drop in the pound yesterday, as many expected interest rates to rise. Today, all the attention will be placed on the data on the US labor market. No major UK reports are released in the morning, but a number of central bank officials are speaking. Their statements could create additional problems for pound bulls. The bulls' top priority is to protect support at 1.3484. Forming a false breakout there will return the chance for an upward correction of the pair within the day, which will lead to a renewal of resistance at 1.3530. An equally important task is to regain control over this level. A breakthrough and reverse test from top to bottom of this range will give a signal to buy the pound, which will lead to the pair moving up to 1.3572 and 1.3608, where I recommend taking profits. The next target will be the high of 1.3650, which will be available only in case of the worst report on the US labor market. If the pair is down in the first half of the day and the bulls are not active around 1.3484, the best option for buying the pound will be a test of the next support at 1.3437. However, I advise you to open long positions there only after a false breakout. You can observe buying GBP/USD immediately for a rebound from a new low like 1.3375, or even lower - from support at 1.3308, counting on a correction of 25-30 points within the day.
To open short positions on GBP/USD, you need:
The bears completely control the market and only support at 1.3484 keeps them from a new wave of decline, which they will be aiming for in the first half of the day. All they need is a breakthrough and a reverse test of this level from the bottom up - generating a signal to open new short positions. However, before selling at the lows, pay attention to the divergence that is forming on the MACD indicator - this can limit the downward potential of the pair in the morning. A breakthrough of 1.3484 will open a straight path to the lows of 1.3437 and 1.3375, where I recommend taking profits. The next target will be the area of 1.3308, but access to it will open in case of good data on the US labor market. In case of an upward correction of the pair in the first half of the day, forming a false breakout in the area of 1.3530 will be the first signal to open short positions. If the GBP/USD rises above this level, it is best to postpone short positions until the larger resistance of 1.3572, just below which the moving averages are, limiting the upward correction of the pair. I advise to open short positions immediately on a rebound from 1.3608, or even higher - from a new high in the 1.3650 area, counting on the pair's rebound down by 20-25 points within the day.

I recommend for review:
The Commitment of Traders (COT) report for October 19 revealed that short positions decreased while long positions increased, which reflects the upward trend in the pound, observed in the middle of this month. This resulted in the return of the net position of a positive value. Speeches and statements of representatives of the Bank of England claiming that it is necessary to take inflationary pressures more seriously also add to the bulls' confidence. BoE Governor Andrew Bailey's speech last week was well received in the market as he reiterated his stance on changing monetary policy. However, a slight slowdown in monthly and annual inflation growth in the UK limited the pair's upward potential in the middle of the week, which resulted in it being locked in the horizontal channel. I advise you to count on further strengthening of the pound and take advantage of any short-term decline that may occur in case of weak fundamental statistics. The COT report indicated that long non-commercial positions rose from 46,794 to 49,112, while short non-commercials dropped from 58,773 to 47,497. This led to a change in the non-commercial net position from negative to positive. The delta was 1615, against 11,979 a week earlier. The closing price of GBP/USD increased significantly: from 1.3591 to 1.3735.
Indicator signals:
Moving averages
Trading is carried out below 30 and 50 moving averages, which indicates a continued decline in the pound in the short term.
Note: The period and prices of moving averages are considered by the author on the H1 hourly chart and differs from the general definition of the classic daily moving averages on the daily D1 chart.
Bollinger Bands
In case of growth, the upper border of the indicator in the area of 1.3572 will act as a resistance. The lower border at 1.3437 will act as a support.
Description of indicators
- Moving average (moving average, determines the current trend by smoothing out volatility and noise). Period 50. It is marked in yellow on the chart.
- Moving average (moving average, determines the current trend by smoothing out volatility and noise). Period 30. It is marked in green on the chart.
- MACD indicator (Moving Average Convergence/Divergence — convergence/divergence of moving averages) Quick EMA period 12. Slow EMA period to 26. SMA period 9
- Bollinger Bands (Bollinger Bands). Period 20
- Non-commercial speculative traders, such as individual traders, hedge funds, and large institutions that use the futures market for speculative purposes and meet certain requirements.
- Long non-commercial positions represent the total long open position of non-commercial traders.
- Short non-commercial positions represent the total short open position of non-commercial traders.
- Total non-commercial net position is the difference between short and long positions of non-commercial traders.
 English
 Русский
 Bahasa Indonesia
 Bahasa Malay
 ไทย
ไทย Español
 Deutsch
 Български
 Français
 Tiếng Việt
 中文
中文 বাংলা
বাংলা हिन्दी
 Čeština
 Українська
 Română

