 English
  Русский
 Bahasa Indonesia
 Bahasa Malay
 ไทย
ไทย Español
 Deutsch
 Български
 Français
 Tiếng Việt
 中文
中文 বাংলা
বাংলা हिन्दी
 Čeština
 Українська
 Română

Trend analysis (Fig. 1)
GBP / USD may move from 1.3681 (closing of yesterday's daily candle) to the support line (blue bold line) - 1.3622, and then go up to the 50.0% retracement level (yellow dashed line) - 1.3660.
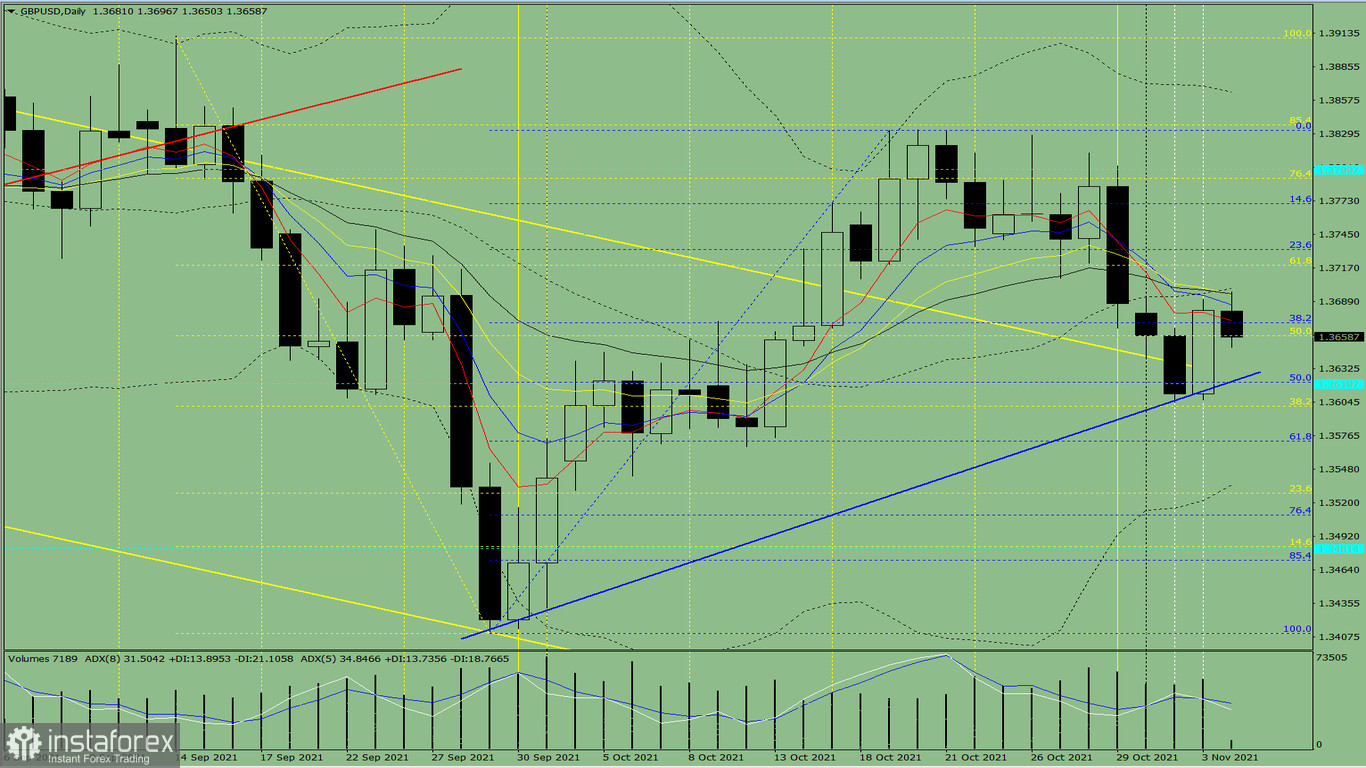
Fig. 1 (daily chart)
Comprehensive analysis:
- Indicator analysis - downtrend;
- Fibonacci levels - downtrend;
- Volumes - downtrend;
- Candlestick analysis - uptrend;
- Trend analysis - uptrend;
- Bollinger bands - downtrend;
- Weekly chart - uptrend.
Conclusion: GBP/USD should decline from 1.3681 (closing of yesterday's daily candle) to the support line (blue bold line) - 1.3622, and then rise to the 50.0% retracement level (yellow dashed line) - 1.3660.
That being said, there is little chance that after moving down from 1.3681 (closing of yesterday's daily candle) to the support line (blue bold line) - 1.3622, GBP/USD will drop lower to the the 61.8% retracement level (blue dashed line) - 1.3572.