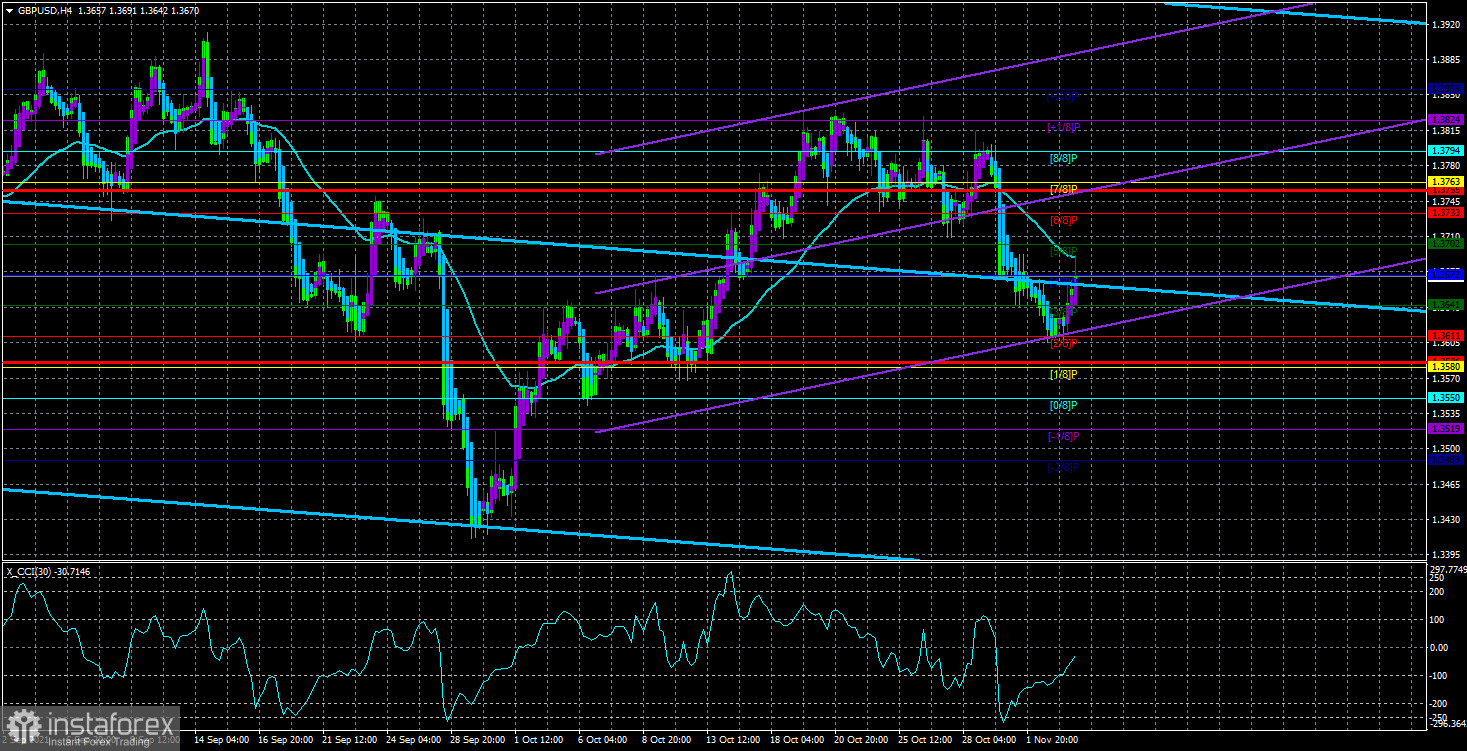
4-hour timeframe

Technical details:
Higher linear regression channel: direction - downward.
Lower linear regression channel: direction - upward.
Moving average (20; smoothed) - sideways.
The GBP/USD currency pair traded "according to its own rules" on Tuesday. Once again, let's pay attention to the fact that the euro and the pound traded completely differently yesterday. On the one hand, it can be assumed that the fundamental or macroeconomic background is to blame for this. On the other hand, on the eve of such an important event as the Fed meeting, both major pairs could show more similar dynamics. However, it seems that the "first side" still played a role. During yesterday, Christine Lagarde's speech and the publication of the unemployment report took place in the European Union. In the UK - Andrew Bailey's speech and the publication of business activity indices. And in the USA - indices of business activity in the service sector, the ADP report. These are the events that happened before the announcement of the results of the Fed meeting. Thus, indeed, pairs could and probably should have moved differently yesterday. The pound was in a moderate upward movement for most of the day. Although it had been in a fall for days earlier. However, if you look at the hourly TF, it is visible that during these two days the pair was mainly between the extreme levels of 1.3607 and 1.3667. But on the 4-hour TF all this time, the pair was located below the moving average line. Yesterday, the CCI indicator entered the oversold area, which usually means an imminent upward reversal. However, it will be necessary to analyze the technical picture only tonight. We deliberately do not consider the movements of yesterday that happened in the evening. And today the same situation will be with the meeting of the Bank of England. It is impossible to predict what decisions will be made. Just as it is impossible to predict what the reaction of the markets will be to this event.
The Bank of England is preparing to tighten, unlike the ECB.
As we have already written in other articles, now it is the ECB that has the least chance of tightening monetary policy. Of course, we cannot analyze the cash flows that continue to flow from the ECB into the economy. Nevertheless, it is not the first time that Christine Lagarde has not been too optimistic about the state of the European economy, and yesterday she openly stated that a rate increase should not be expected next year. Thus, now we need to understand what actions the Bank of England is going to take. Recall that it is necessary to build on this issue only on how many members of the monetary committee will vote today to reduce the quantitative stimulus program, which in the UK amounts to 895 billion pounds. Last time there were two of them out of nine. Any increase in this number will be a "hawkish factor" and may support the British currency. At the same time, the talk around the British Central Bank concerns not only the curtailment of QE but also the increase in the key rate. We all understand that raising the rate before the Fed is a very risky step for the British Central Bank. In other words, the Fed usually "sets the tone" as the central bank in the country with the strongest economy in the world. However, some experts are seriously saying now that the Bank of England may present a surprise. It is worth noting that, probably, these conversations are still pure gossip. It is unlikely that BA will start raising the rate without completing the QE program. Thus, for the British currency, the main thing today will be the results of the monetary committee's vote for curtailing the QE program, as well as the speech of Chairman Andrew Bailey. However, it should be remembered that the results of the Fed meeting were summed up last night, and European and British traders could not work out this information. Thus, the movements this morning may be echoes of yesterday's Fed meeting. And intersect with the reaction to the results of the Bank of England meeting today. Therefore, do not be surprised if the pound will be a little "stormy" today. This is normal for such days when the calendars of macroeconomic events are bursting with such.

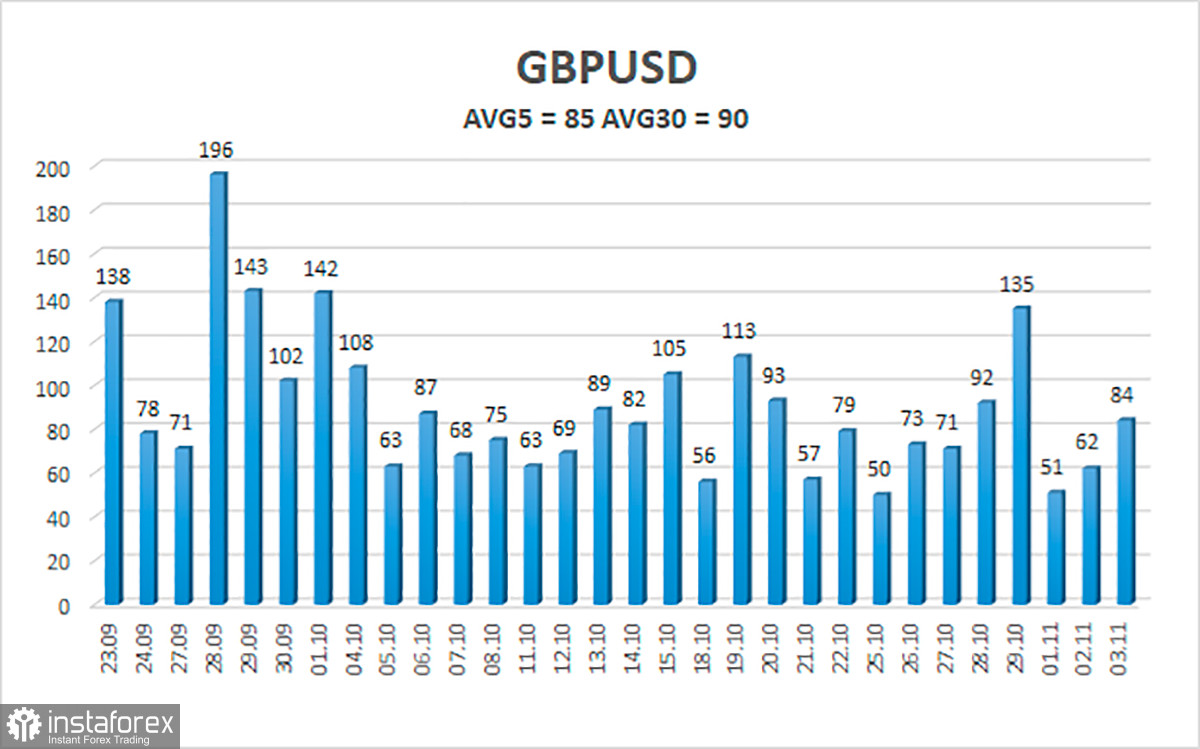
The average volatility of the GBP/USD pair is currently 85 points per day. For the pound/dollar pair, this value is "average". On Thursday, November 4, we expect movement inside the channel, limited by the levels of 1.3586 and 1.3755. The reversal of the Heiken Ashi indicator downwards signals the resumption of the downward movement.
Nearest support levels:
S1 – 1.3641
S2 – 1.3611
S3 – 1.3580
Nearest resistance levels:
R1 – 1.3672
R2 – 1.3702
R3 – 1.3733
Trading recommendations:
The GBP/USD pair continues to be below the moving average on the 4-hour timeframe, so the trend remains downward. Thus, at this time, new short positions should be considered with the targets of 1.3641 and 1.3611 levels in case of a rebound from the moving average. Buy orders can be considered again if the price is fixed above the moving average line with targets of 1.3733 and 1.3755 and keep them open until the Heiken Ashi turns down.
We recommend you to familiarize yourself:
Overview of the EUR/USD pair. November 4. Macroeconomic statistics and Christine Lagarde's speech.
Explanations to the illustrations:
Linear regression channels - help determine the current trend. If both are directed in the same direction, then the trend is strong now.
Moving average line (settings 20.0, smoothed) - determines the short-term trend and the direction in which trading should be conducted now.
Murray levels - target levels for movements and corrections.
Volatility levels (red lines) - the likely price channel in which the pair will spend the next day, based on current volatility indicators.
CCI indicator - its entry into the oversold area (below -250) or into the overbought area (above +250) means that a trend reversal in the opposite direction is approaching.
 English
 Русский
 Bahasa Indonesia
 Bahasa Malay
 ไทย
ไทย Español
 Deutsch
 Български
 Français
 Tiếng Việt
 中文
中文 বাংলা
বাংলা हिन्दी
 Čeština
 Українська
 Română

