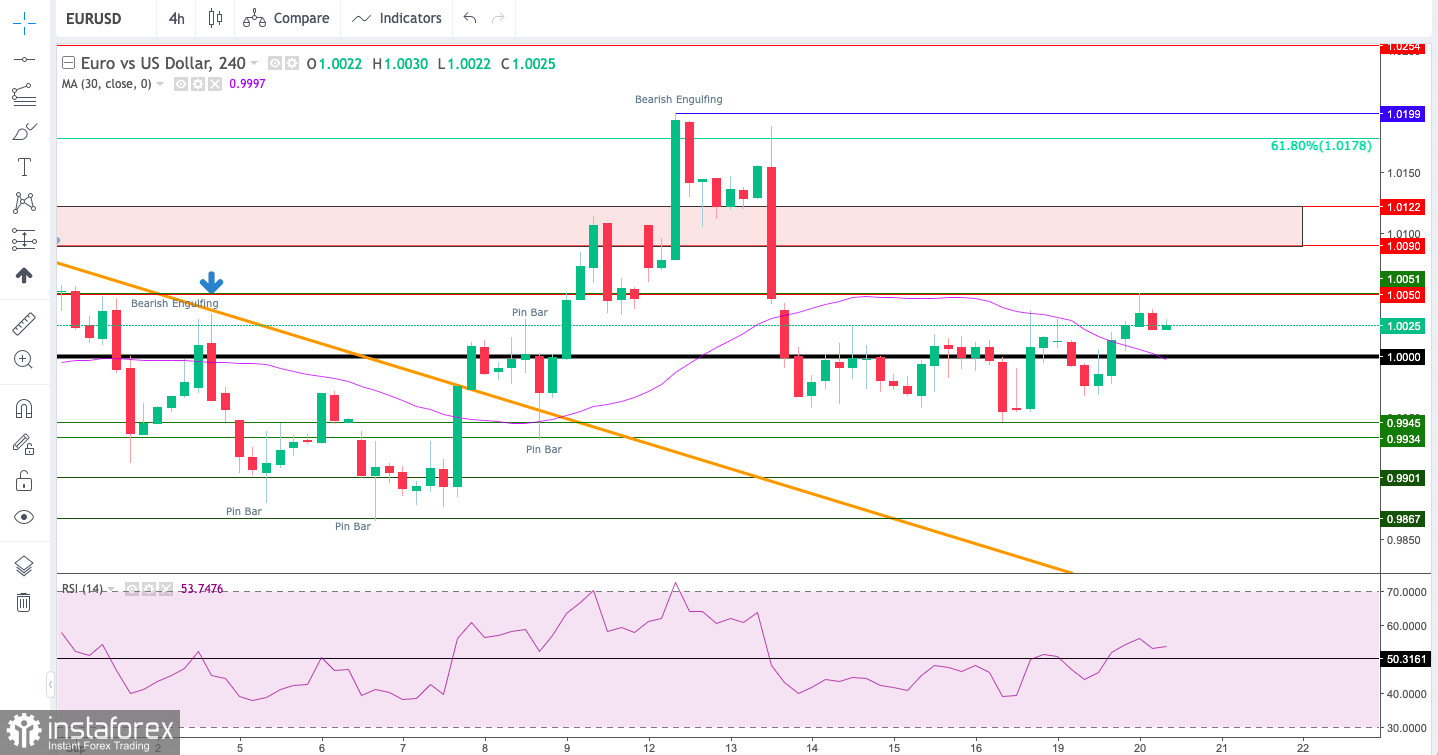
Technical Market Outlook:
The EUR/USD pair has broken out from a narrow range located between the levels of 1.0025 - 0.9959 on the H4 time frame chart and made a local high at the level of 1.0050 so far. The level of 1.0019 will now act as a local support for bulls on their way towards the next target located at 1.0090. The nearest technical support is seen at 0.9934 and 0.9901. In the longer term, the key technical resistance level is located at 1.0389 (swing high from August 11th), so the bulls still have a long road to take before the longer term down trend is reversed. Please watch the USDX as the correlation between this two is directly opposite.

Weekly Pivot Points:
WR3 - 1.01231
WR2 - 1.00595
WR1 - 1.00262
Weekly Pivot - 0.99959
WS1 - 0.99626
WS2 - 0.99323
WS3 - 0.98687
Trading Outlook:
Despite the recent relief rally towards the short-term support, the EUR is still under the strong bearish pressure and as long as the USD is kept being bought all across the board, the down trend will continue. In the mid-term, the key technical resistance level is located at 1.0389 and only if this level is clearly violated, the down trend might be considered terminated.
 English
 Русский
 Bahasa Indonesia
 Bahasa Malay
 ไทย
ไทย Español
 Deutsch
 Български
 Français
 Tiếng Việt
 中文
中文 বাংলা
বাংলা हिन्दी
 Čeština
 Українська
 Română

