4-hour timeframe

Technical details:
Higher linear regression channel: direction - downward.
Lower linear regression channel: direction - upward.
Moving average (20; smoothed) - sideways.
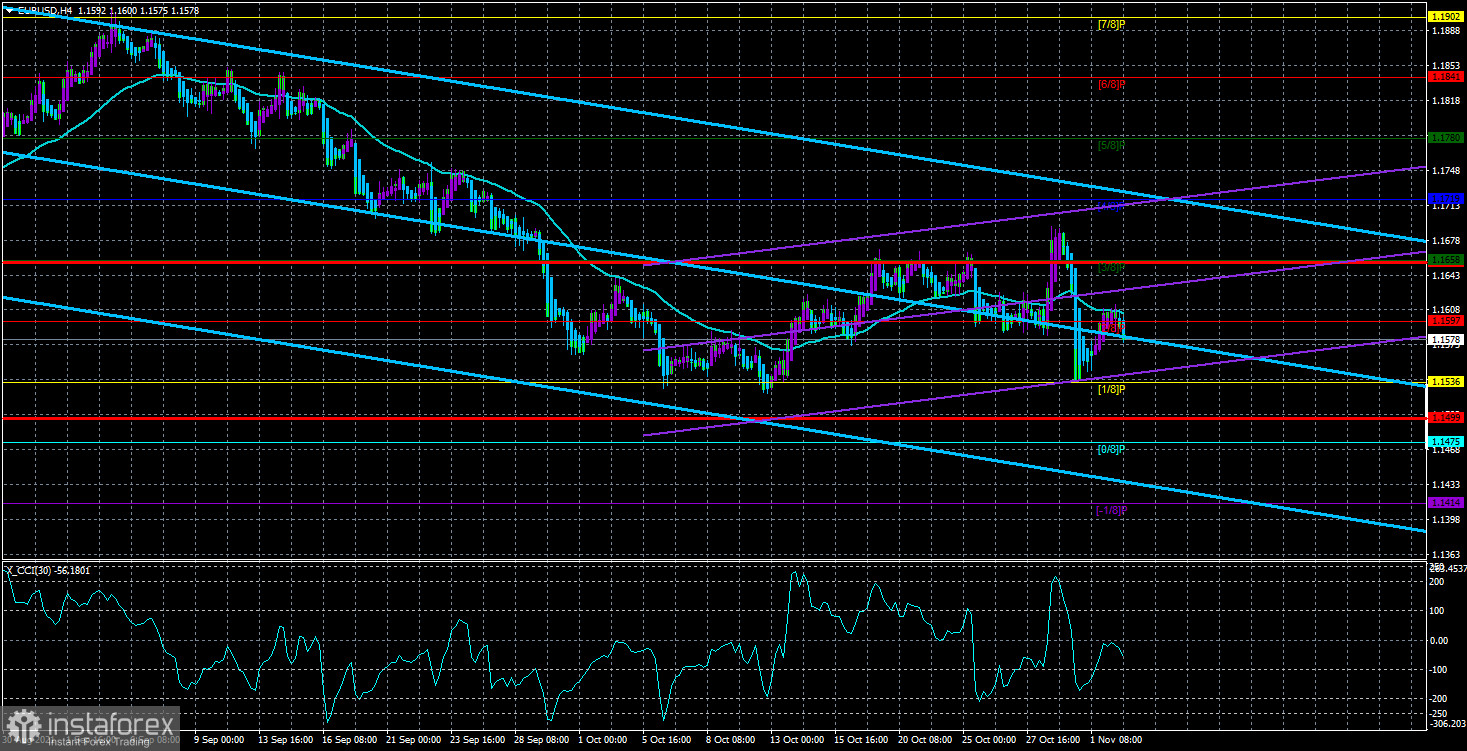
The EUR/USD currency pair adjusted to the moving average line on Tuesday and turned out to be where it was until the last two ultra-volatile days of last week. Take a close look at the illustration above. The price at the beginning of last month dropped to the level of Murray "1/8" - 1.1536 and bounced off it twice. Then it doubled to the level of Murray "3/8" - 1.1658 and bounced off it three times. And at the end of last week, the quotes made a march to the level of 1.1658, after which they sharply collapsed down again to the level of 1.1536. For the entire past month, even taking into account the movements at the end of last week, the euro/dollar pair was between the levels of 1.1536 and 1.1658 (inside a side channel with a width of about 120 points. We can say that last month's volatility was exactly 120 points. Thus, even the increase in volatility last Thursday and Friday did not change the current technical picture in any way. Moreover, volatility is still low, if we do not take into account the last two days of the past week. The movement on Thursday and Friday is becoming more and more like an ordinary coincidence, a confluence of circumstances that was not supported by any clear fundamental or macroeconomic reasons. Moreover, the logic in the movement of the pair was on Thursday. However, on Friday, when the quotes of the euro currency collapsed down by 150 points, there was no logic in the actions of market participants. It can be assumed that in general, the US dollar has been getting more expensive in the last few months against the euro based on the high probability of curtailing the Fed's QE program. However, this still does not explain the collapse of the euro last Friday. In one day, the pair passed more than the total for the week before.
Markets know what to expect from the Fed.
Thus, the upcoming Fed meeting and the announcement of its results may be a mere formality. What does it mean? It means that if the US dollar paired with the euro and generally took into account the macroeconomic and fundamental factors of recent times, it has long taken them all into account. In other words, whatever decision the Fed makes, it has already been taken into account in the current rate of the pair. And the Fed can either announce the beginning of a reduction in asset purchases this month or wait with this decision until December. However, in any case, the curtailment of the QE program will begin in the coming months and will end by mid-2022. Therefore, by and large, it is no longer so important when exactly this folding will begin.
The same applies to the volume of reduction of the QE program. It was already announced at the last meeting that a reduction of $ 15 billion will follow. And if you divide the entire amount by 15, you get 8. Therefore, the Fed is going to reduce the stimulus program by $ 15 billion every month, which will allow it to be fully completed by the middle of next year. The only thing that makes us somewhat doubtful about the end of incentives is the weak macroeconomic statistics in the last two months. However, even here, if desired, you can explain everything. The same GDP, which in the third quarter turned out to be at the level of only 2.0% q/q, may accelerate again to 6.6% q/q in the fourth quarter, judging by experts' forecasts. Still, in the third quarter, there was again a surge in the number of coronavirus diseases, not only in the United States but also in the EU countries. Thus, it is not surprising that the economy has slowed down a bit. The same goes for Nonfarm. Given the new COVID outbreak, it is not surprising that this indicator fell short of the forecast values for two months in a row. However, everything should get better in the fourth quarter. And most importantly, it seems that the members of the Fed monetary committee themselves believe this. If we heard doubts or uncertain rhetoric from them, then we could doubt the decision to tighten in November. However, they did not express anything of the kind, therefore, most likely, the reduction of the QE program will be announced today.

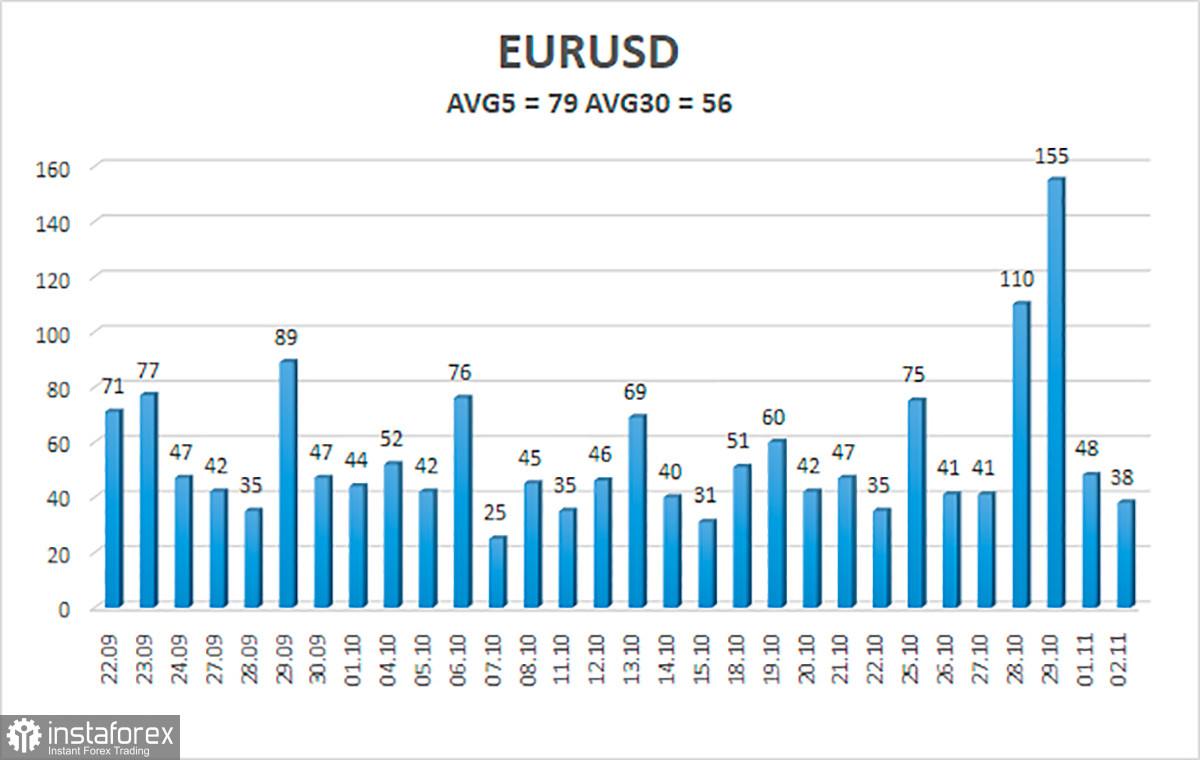
The volatility of the euro/dollar currency pair as of November 3 is 79 points and is characterized as "average". Thus, we expect the pair to move today between the levels of 1.1499 and 1.1657. The reversal of the Heiken Ashi indicator back down will signal the resumption of the downward movement.
Nearest support levels:
S1 – 1.1536
S2 – 1.1475
S3 – 1.1414
Nearest resistance levels:
R1 – 1.1597
R2 – 1.1658
R3 – 1.1719
Trading recommendations:
The EUR/USD pair continues to be below the moving average line. Thus, today, we should consider new short positions with targets of 1.1536 and 1.1499 after the reversal of the Heiken Ashi indicator down. Purchases of the pair should be considered if the price is fixed above the moving average, with a target of 1.1658, and keep these trades open until the Heiken Ashi indicator turns down.
Explanations to the illustrations:
Linear regression channels - help to determine the current trend. If both are directed in the same direction, then the trend is strong now.
The moving average line (settings 20.0, smoothed) - determines the short-term trend and the direction in which trading should be conducted now.
Murray levels - target levels for movements and corrections.
Volatility levels (red lines) - the likely price channel in which the pair will spend the next day, based on current volatility indicators.
CCI indicator - its entry into the oversold area (below -250) or into the overbought area (above +250) means that a trend reversal in the opposite direction is approaching.
 English
 Русский
 Bahasa Indonesia
 Bahasa Malay
 ไทย
ไทย Español
 Deutsch
 Български
 Français
 Tiếng Việt
 中文
中文 বাংলা
বাংলা हिन्दी
 Čeština
 Українська
 Română

