 English
  Русский
 Bahasa Indonesia
 Bahasa Malay
 ไทย
ไทย Español
 Deutsch
 Български
 Français
 Tiếng Việt
 中文
中文 বাংলা
বাংলা हिन्दी
 Čeština
 Українська
 Română

Trend analysis (Fig. 1)
The price from the level of 1.3741 (closing of yesterday's daily candle) is expected to surge today, namely to the target of 1.3792 – the pullback level of 76.4% (yellow dotted line). After testing this level, it may further increase to the target of 1.3837 – the pullback level of 85.4% (yellow dotted line).
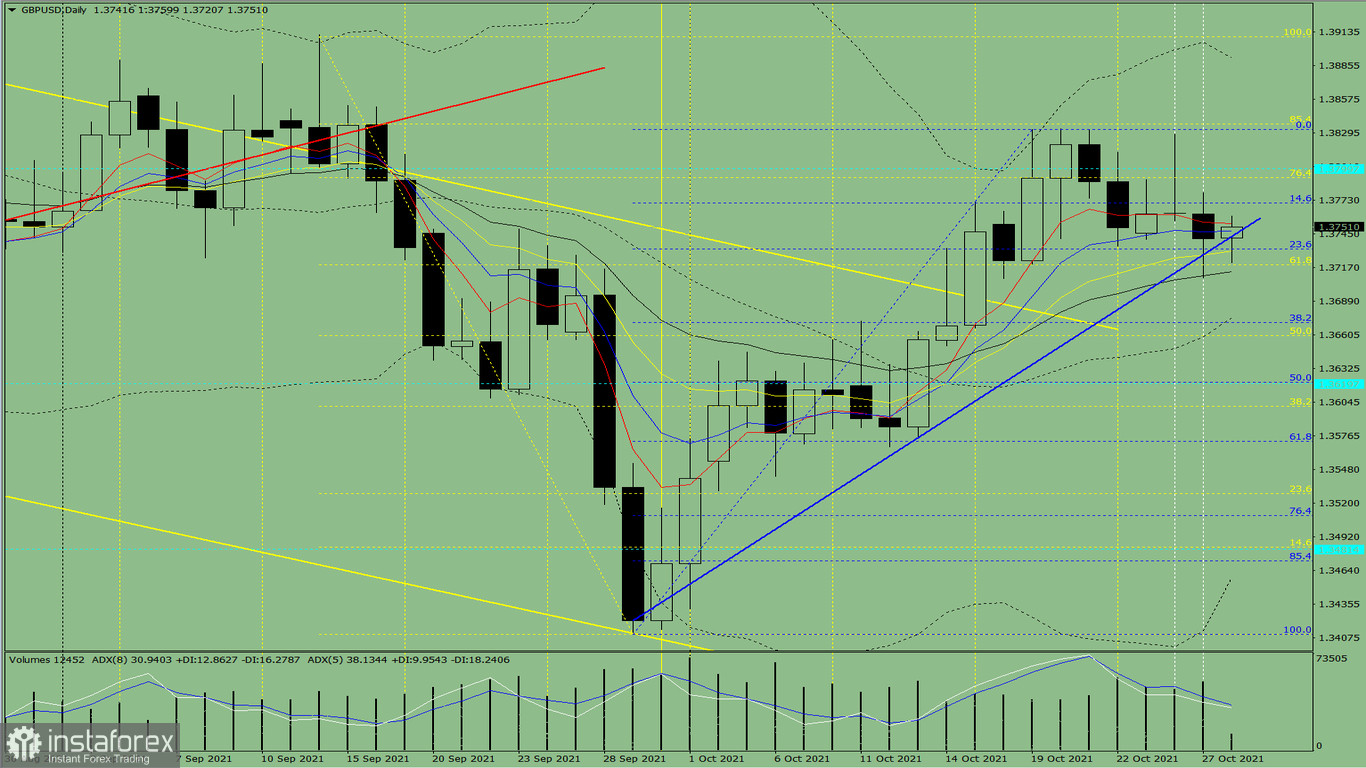
Figure 1 (daily chart)
Comprehensive analysis:
- Indicator analysis - up
- Fibonacci levels - up
- Volumes - up
- Candlestick analysis - up
- Trend analysis - up
- Bollinger lines - up
- Weekly chart - up
General conclusion:
Today, the price from the level of 1.3741 (closing of yesterday's daily candle) will rise to the target of 1.3792 – the pullback level of 76.4% (yellow dotted line). Once this level is tested, growth may resume to the target of 1.3837 – the pullback level of 85.4% (yellow dotted line).
As an alternative, the price from the level of 1.3741 (closing of yesterday's daily candle) will climb to the target of 1.3792 – the pullback level of 76.4% (yellow dashed line) and then decline to the target of 1.3670 – the pullback level of 38.2% (blue dotted line).