Wave pattern
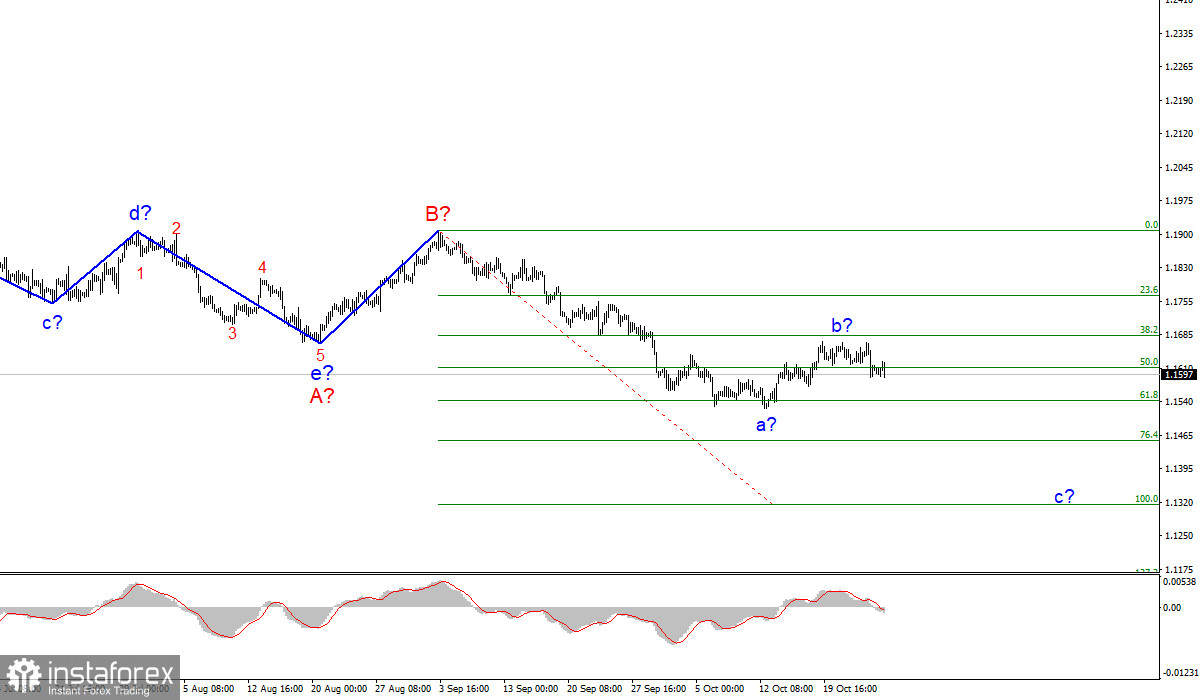
The wave counting of the 4-hour chart for the Euro/Dollar instrument has undergone certain changes, but at the moment it looks quite holistic. Thus, now the a-b-c-d-e trend segment, which has been formed since the beginning of the year, is interpreted as wave A, and the subsequent increase in the instrument is interpreted as wave B. If this assumption is correct, then the construction of the proposed wave C has now begun and is continuing, which can take a very extended form.
The exit of quotes from the reached highs means that the expected wave b can be completed. If this is indeed the case, then the construction of wave c has now begun, which can also turn out to be very long. Thus, the targets are located below the 15th figure, up to the 13th. At the same time, wave b can take a more complex, three-wave form. Although at the moment it looks quite complete. Deep corrections are not accepted inside the current wave C.
There was no news background for the EUR/USD instrument on Tuesday. Markets continue to expect the ECB meeting this week, and the Fed meeting next week. I do not think that the first or second event will greatly affect the mood of the markets, but it is possible.
The Euro/Dollar instrument has been trading very inactive for a long time. Tuesday's amplitude was only 18 pips. And there are a clear majority of such days now. Thus, the ECB or the Fed will need to try very hard to make the markets start trading more actively. What is needed for this to happen? Important decisions must be made. Decisions that will affect monetary policy and the economy. And with those in recent months and even a year, there has been a clear strain.
The markets do not even dream of raising rates, and incentive programs in the European Union and the United States are being discussed more than they are being curtailed. It is possible that the Fed will announce the beginning of this process on November 3, but the markets have been waiting for this for several months and, most likely, have already taken into account this decision of the American central bank.
In the case of the European Central Bank, the situation is even more boring. Inflation in the EU is not "excessively high," so there is no point in the bank rushing to complete the PEPP program. Consequently, the chances of its curtailment are much less than for the tapering of QE in the United States. Thus, this Thursday, the ECB may not please the markets with anything, and the amplitude of the instrument may remain the same as it has remained in recent months, that is, low. I would also like to note that the news background of tomorrow will also be almost zero.
General conclusions
Based on the analysis, I conclude that the construction of the downward wave C will continue, and its internal corrective wave has completed its construction. Therefore, now I advise you to sell the instrument for each signal from the MACD "down," with targets located near the calculated marks of 1.1454 and 1.1314, which corresponds to 76.4% and 100.0% Fibonacci levels. A successful attempt to break through the 50.0% Fibonacci level may indicate that the markets are ready to sell the instrument.
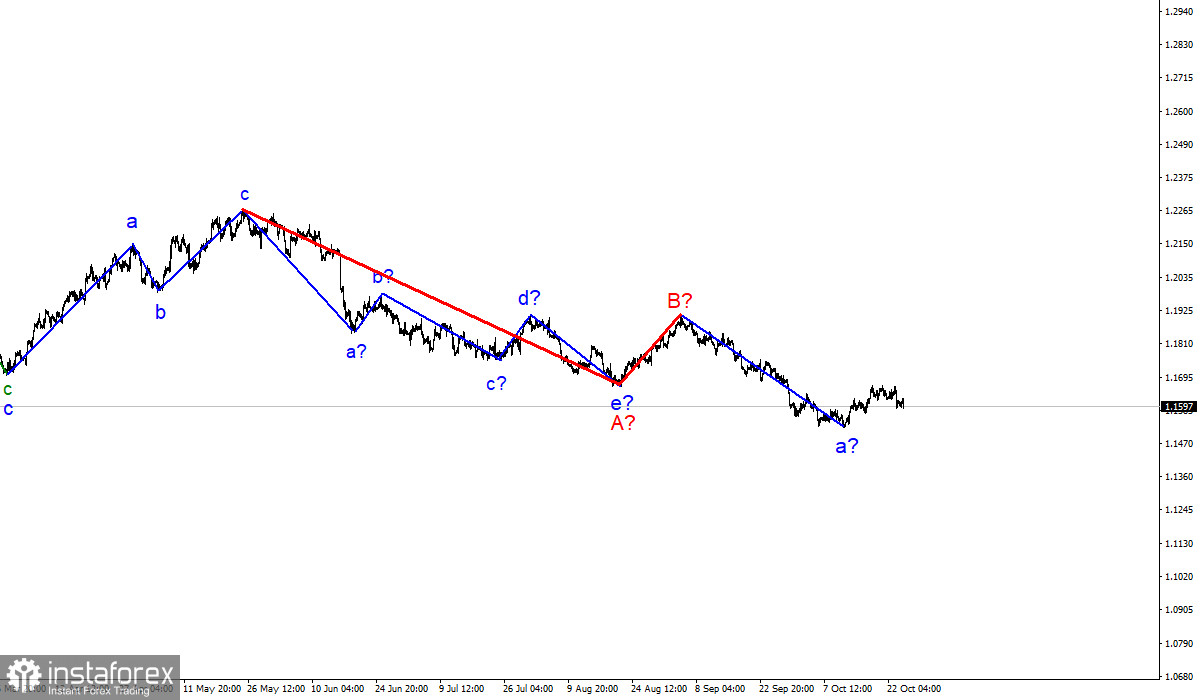
The wave counting of the higher scale looks quite convincing. The decline in quotes continues and now the downward section of the trend, which originates on May 25, takes the form of a three-wave corrective structure A-B-C. Thus, the decline may continue for several more months until wave C is fully completed.
 English
 Русский
 Bahasa Indonesia
 Bahasa Malay
 ไทย
ไทย Español
 Deutsch
 Български
 Français
 Tiếng Việt
 中文
中文 বাংলা
বাংলা हिन्दी
 Čeština
 Українська
 Română


