Hello dear traders!
I will start my today's review of the GBP/USD currency pair with the fact that during the trades on October 18-22 the British pound showed almost zero dynamics. That is, the opening price of last week's trading coincided with its closing price. As usual, the main attention in this article will be focused on the technical component. However, before providing this data I will mention some other facts. It concerns the COVID-19 pandemic, particularly its fourth wave, which is not going to subside despite the fact that in many countries the majority of people have already been vaccinated. In the United Kingdom, for example, the number of infected people has been over 40,000 for two weeks in a row. This is a rather worrying sign, which could lead to another lockdown that affects the UK economic recovery. However, British Prime Minister Boris Johnson is doing his best not to impose restrictions.
Like all other countries, the UK authorities continue to place the main emphasis on vaccinating the population. In Britain, more than 800,000 people have been vaccinated in the last few days. This figure looks impressive. However, time will tell if it will lead to the desired result. Analyzing this week's economic calendar, there are almost no UK macroeconomic reports. Consequently, the US statistics will exert a powerful influence on the price dynamics of the GBP/USD pair. Today, at 15:30 MSK the Chicago Federal Reserve Bank's economic activity index will be considered relevant. The following macroeconomic statistics will be mentioned on the day of their release. Let's start discussing the technical picture. Considering the fact that last Friday the market closed another trading week, let's observe this timeframe.
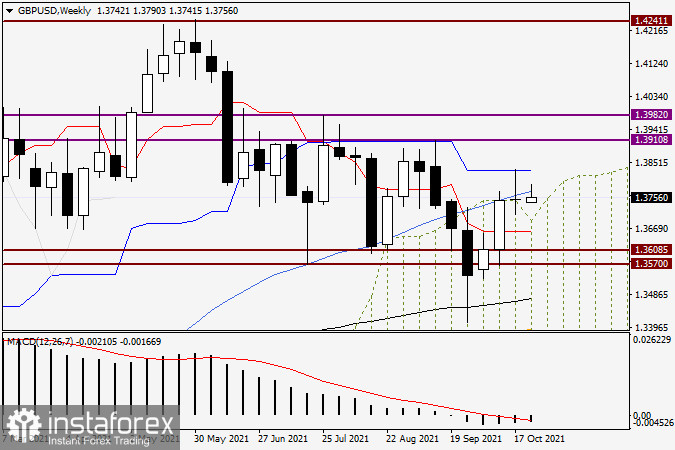
Weekly

As mentioned at the beginning of this article, the pair didn't move up or down during the last trading week. Consequently, a classic Doji candlestick pattern was formed on the weekly chart. Notably, the blue Kijun line of the Ichimoku indicator did not allow the price to rise. It is not clear whether the upward pair's exit from the cloud can be considered true as the weekly trades were closed on the upper boundary of the cloud. Besides, there are some issues, which bulls will have to tackle in the near future. I assume that if the pair does not make a break upwards, its rate may decline rather significantly.
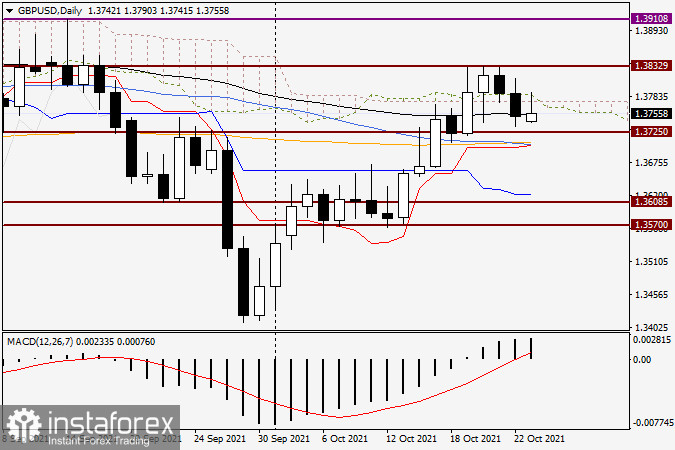
Daily

On the daily chart, the technical picture is not definite. The pair is barreling around the black 89-exponential moving average and both boundaries of the daily cloud. A very strong support may occur near the significant level of 1.3700. As shown on the chart, the 50-MMA, the 200-MMA, and the red Tenkan line pass here. In case the pair descends to this area, it is possible to buy the pound. Besides, bullish Japanese candlestick patterns in this or the smaller time frames will be a confirming signal. The nearest daily resistance at 1.3832 is still difficult to break. If it fails and there are bearish candlestick signals below this level, it is possible to try to sell. Objectives of buying are in the area of 1.3800-1.3830. I recommend making sales in the price zone of 1.3740-1.3710.
Good luck!
 English
 Русский
 Bahasa Indonesia
 Bahasa Malay
 ไทย
ไทย Español
 Deutsch
 Български
 Français
 Tiếng Việt
 中文
中文 বাংলা
বাংলা हिन्दी
 Čeština
 Українська
 Română

