To open long positions on GBP/USD, you need:
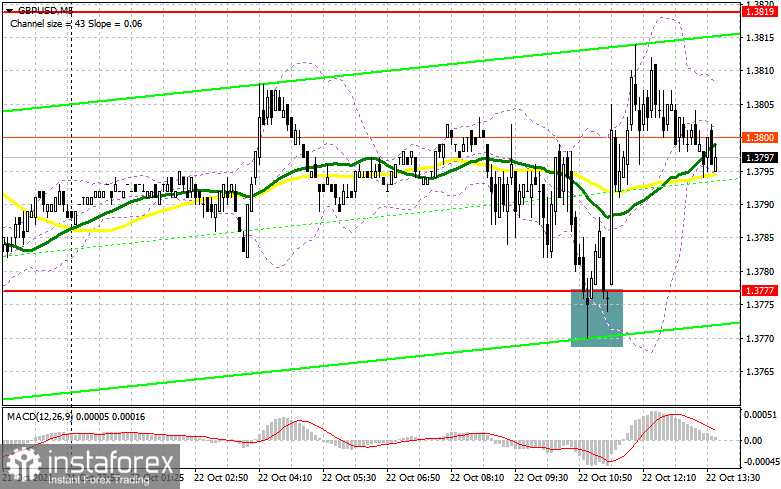
In the first half of the day, one signal was formed to buy the British pound, after which the pair moved up by 40 points. Let's look at the 5-minute chart and analyze the entry point. Good data on activity in the UK allowed the bulls to protect the support of 1.3777. The formation of a false breakdown there, which I paid attention to in the morning forecast, led to a good entry point into long positions. Unfortunately, there was no larger continuation, and we did not even reach the nearest resistance of 1.3819. From a technical point of view, nothing has changed for the second half of the day.
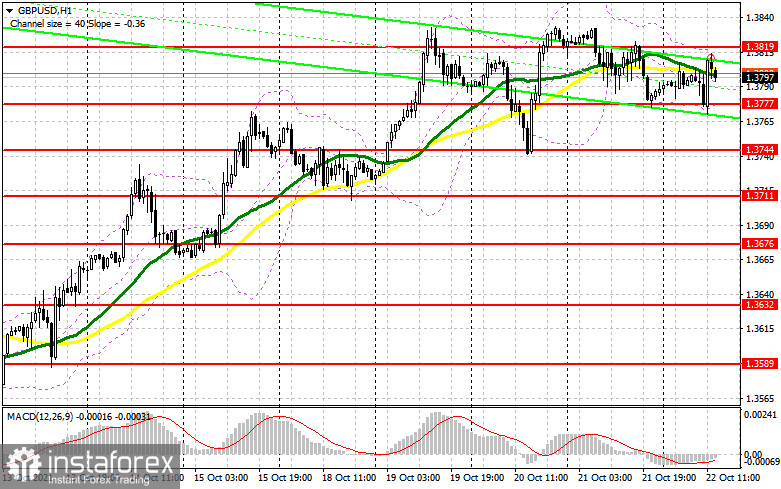
We are waiting for similar data on activity in the manufacturing sector and the US service sector during the American session. Good data may lead to a return of pressure on the US dollar. The primary task of the bulls remains to protect the important support of 1.3777, which they coped with perfectly in the first half of the day. Since the pair is gradually moving into the side channel, a fairly large number of buyers' stop orders may be concentrated below 1.3777. Only another false breakdown formation in the afternoon at this level will lead to a good entry point into long positions. The target will be a break above 1.3819. The reverse test of this level from top to bottom will give a new entry point into long positions and allow you to get to new local highs: 1.3864 and 1.3910, where I recommend fixing the profits. The 1.3955 area remains a longer-range target. In the scenario of the absence of active actions on the bulls in the area of 1.3777, the best option for buying the pound will be a test of the next support of 1.3744, which acts as a kind of lower boundary of a wider side channel. However, I advise you to open long positions there only after a false breakdown. You can watch the GBP/USD purchases immediately for a rebound only from the minimum of 1.3711, or even lower - from the support of 1.3676, counting on a correction of 25-30 points within the day.

To open short positions on GBP/USD, you need:
The sellers had a real chance, but they didn't take it. Strong data on the UK did not allow the level of 1.3777 to fail. Now a lot will depend on important macroeconomic indicators for activity in the United States. If the data turns out to be better than economists' forecasts, the bears may prefer to achieve a breakthrough of 1.3777 again. Only a reverse test from the bottom up of this area will form a signal to open short positions in the expectation of a decline in the pair to 1.3744. A more distant target will be the 1.3711 area, which will finally finish off buyers. I recommend fixing profits there. If the pair recovers after the US activity data, only the formation of a false breakdown in the resistance area of 1.3819 will signal the opening of short positions in GBP/USD. I advise selling the pound immediately for a rebound from a larger resistance of 1.3864, or even higher - from a maximum of 1.3910, counting the pair's rebound down by 20-25 points inside the day.

The COT reports (Commitment of Traders) for October 12 recorded a reduction in short and long positions. However, the former turned out to be more, which led to a slight recovery of the negative net position. Despite the bears' rather active attempts at the beginning of that week to resist the bullish trend, buyers turned out to be stronger, which led to a further increase in the pound against the US dollar. The reduction of several problems with disruptions in supply chains, which shook the pound earlier this month, is now gradually returning to the market players betting on further strengthening of risky assets. Constant speeches and statements by the Bank of England representatives that it is necessary to take inflationary pressure more seriously also add confidence to buyers of the pound. The central bank's meeting minutes last week confirmed the regulator's intentions to take seriously the option of raising interest rates already during the November meeting – a bullish signal for GBP/USD. Therefore, the only problem that stands in the way of buyers of the pound is the US Federal Reserve System. Although they will not raise interest rates, they are also heading for a tightening of monetary policy. However, the British pound looks much more preferable in these conditions. The COT report indicates that long non-commercial positions decreased from the level of 48,137 to the level of 46,794.
In contrast, short non-commercial positions dropped from the level of 68,155 to the level of 58,773, which led to a partial reduction in the advantage of sellers over buyers. As a result, the non-commercial net position was - 11,979 against -20,018. The closing price of GBP/USD remained almost unchanged at the end of the week: 1.3591 against 1.3606.
Signals of indicators:
Moving averages
Trading is conducted around 30 and 50 daily moving averages, indicating an active market control confrontation.
Note: The author considers the period and prices of moving averages on the hourly chart H1 and differ from the general definition of the classic daily moving averages on the daily chart D1.
Bollinger Bands
A break of the lower limit of the indicator in the area of 1.3777 will lead to a major drop in the pair. A break of the upper limit in the area of 1.3815 will lead to a new wave of growth.
Description of indicators
- Moving average (moving average determines the current trend by smoothing out volatility and noise). Period 50. The graph is marked in yellow.
- Moving average (moving average determines the current trend by smoothing out volatility and noise). Period 30. The graph is marked in green.
- MACD indicator (Moving Average Convergence / Divergence - moving average convergence/divergence) Fast EMA period 12. Slow EMA period 26. SMA period 9
- Bollinger Bands (Bollinger Bands). Period 20
- Non-profit speculative traders, such as individual traders, hedge funds, and large institutions that use the futures market for speculative purposes and meet specific requirements.
- Long non-commercial positions represent the total long open position of non-commercial traders.
- Short non-commercial positions represent the total short open position of non-commercial traders.
- Total non-commercial net position is the difference between the short and long positions of non-commercial traders.
 English
 Русский
 Bahasa Indonesia
 Bahasa Malay
 ไทย
ไทย Español
 Deutsch
 Български
 Français
 Tiếng Việt
 中文
中文 বাংলা
বাংলা हिन्दी
 Čeština
 Українська
 Română

