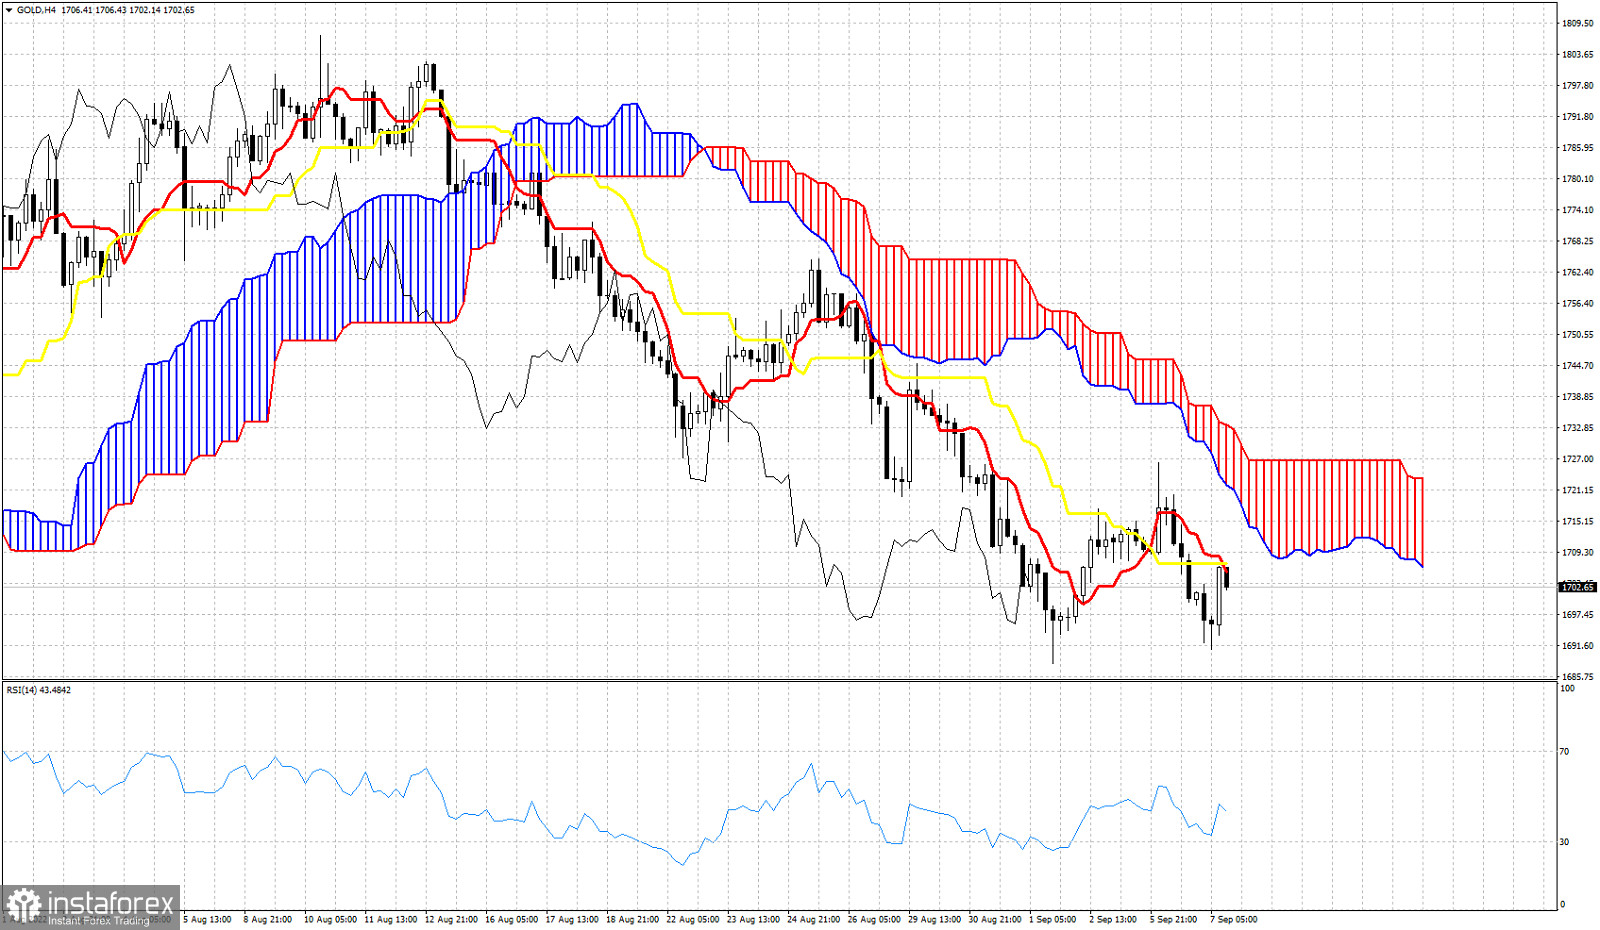
Gold price is trading around $1,700. We use the Ichimoku cloud indicator in order to identify key resistance levels that need to be broken in order for short-term trend to change to bullish. For now bears are in full control of the trend. Price is below the Kumo (cloud) and both the tenkan-sen (red line indicator) and the kijun-sen (yellow line indicator). Price tested the short-term resistance by these two indicators at $1,707. Price is showing rejection signs. A break above the resistance by these two indicators, we should expect price to test the cloud at $1,718 and $1,727. As long as price is below the Kumo (cloud) bears will have the upper hand and price will remain vulnerable to more downside. The Chikou span (black line indicator) is below the candlestick pattern confirming that bears remain in control. Concluding, there is no sign of a reversal yet.
 English
 Русский
 Bahasa Indonesia
 Bahasa Malay
 ไทย
ไทย Español
 Deutsch
 Български
 Français
 Tiếng Việt
 中文
中文 বাংলা
বাংলা हिन्दी
 Čeština
 Українська
 Română

