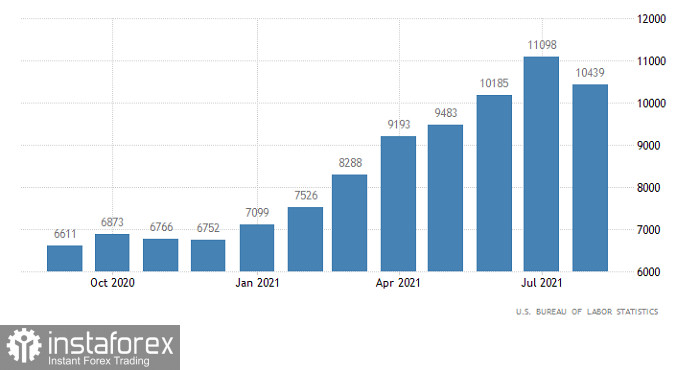
While data on the UK labor market did not affect the pound sterling in any way, the US job openings report somewhat revived the market and boosted the US dollar. The number of job openings in the US dropped to 10.439 million from 11.098 million in the previous period. This data only confirms the results of the US Labor Department report. Since the unemployment rate is decreasing faster than expected, the number of job openings should also decline more rapidly. Generally, speaking, this data only confirmed that the jobs market is recovering well enough so that the Federal Reserve can start monetary policy tightening. Given all that, the greenback went up.
United States Job Openings:

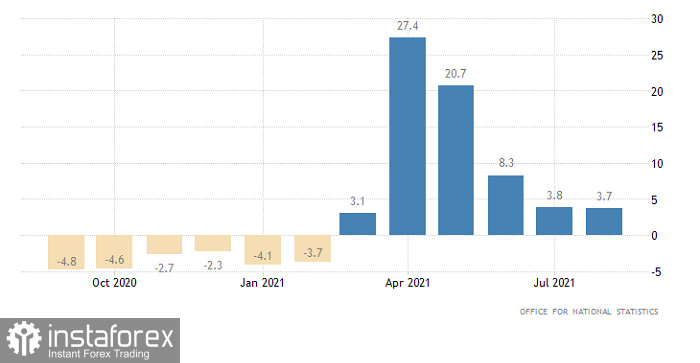
The United Kingdom has recently presented its industrial production statistics. Industrial output growth slowed to 3.7% from 3.8% and compared with the forecast of a 3.2% drop. In addition, the reading was expected to rise by 0.4% from a month earlier but instead, it increased by 0.8%. Nevertheless, the market ignored such positive results.
United Kingdom Industrial Production:

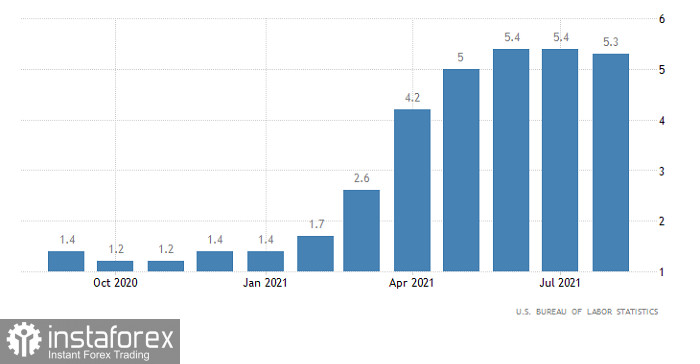
Meanwhile, US inflation published today will be the main event of the entire week. The reading is projected to remain unchanged from the previous period. Only a slowdown in the indicator can make the Federal Reserve delay tapering. Meanwhile, given that inflation remains high, stability or a further increase in the rate may urge the regulator to tighten policy. Such measures are likely to lead to a decrease in the supply of USD in the market and at the same time, boost the currency.
United States Inflation:

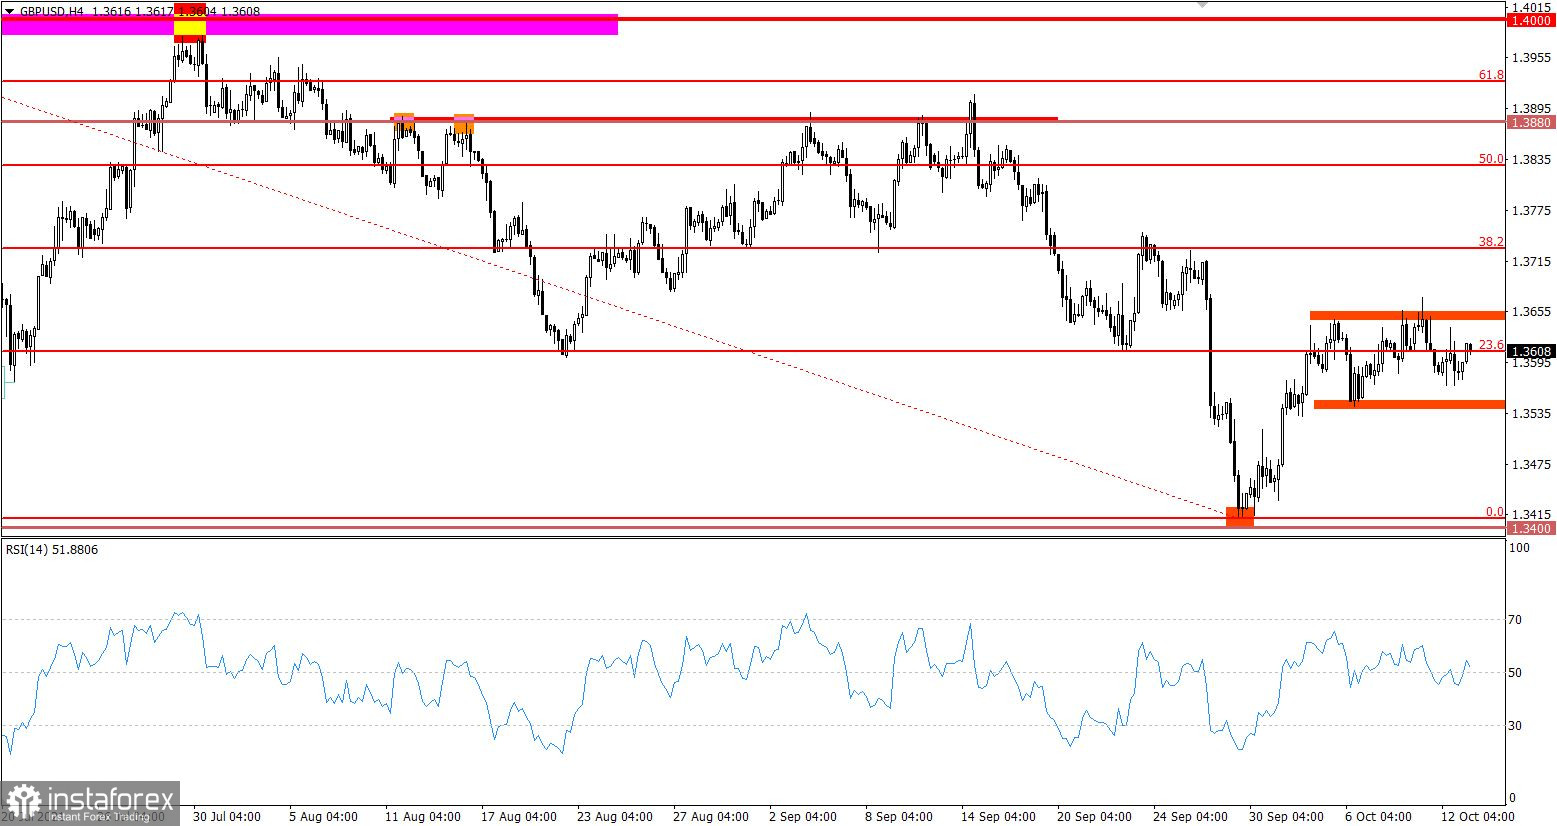
GBP/USD has been traded in the area of the 1.3620/1.3650 resistance zone, which led to the formation of a flat in the 1.3540/1.3670 range.
It can be assumed that a corrective move from the support level of 1.3400 has ended and has been replaced by a flat.
The RSI is moving within line 50 on the H4 chart, signaling price stagnation. This is confirmed by a flat on the chart.
Despite a correction and the sideways movement, the market remains bearish, which is confirmed by the downward trend that started in early June.
Outlook
It can be assumed that the movement in the 1.3540/1.3670 sideways channel will continue for a while.
If this assumption is true, the best trading tactic will be a breakout of one of the boundaries of the established range.
In terms of complex indicator analysis, there is a variable signal on M1 and H1 charts due to price stagnation. Technical indicators are signaling to sell the pair in the medium term amid the bearish market.

 English
 Русский
 Bahasa Indonesia
 Bahasa Malay
 ไทย
ไทย Español
 Deutsch
 Български
 Français
 Tiếng Việt
 中文
中文 বাংলা
বাংলা हिन्दी
 Čeština
 Українська
 Română

