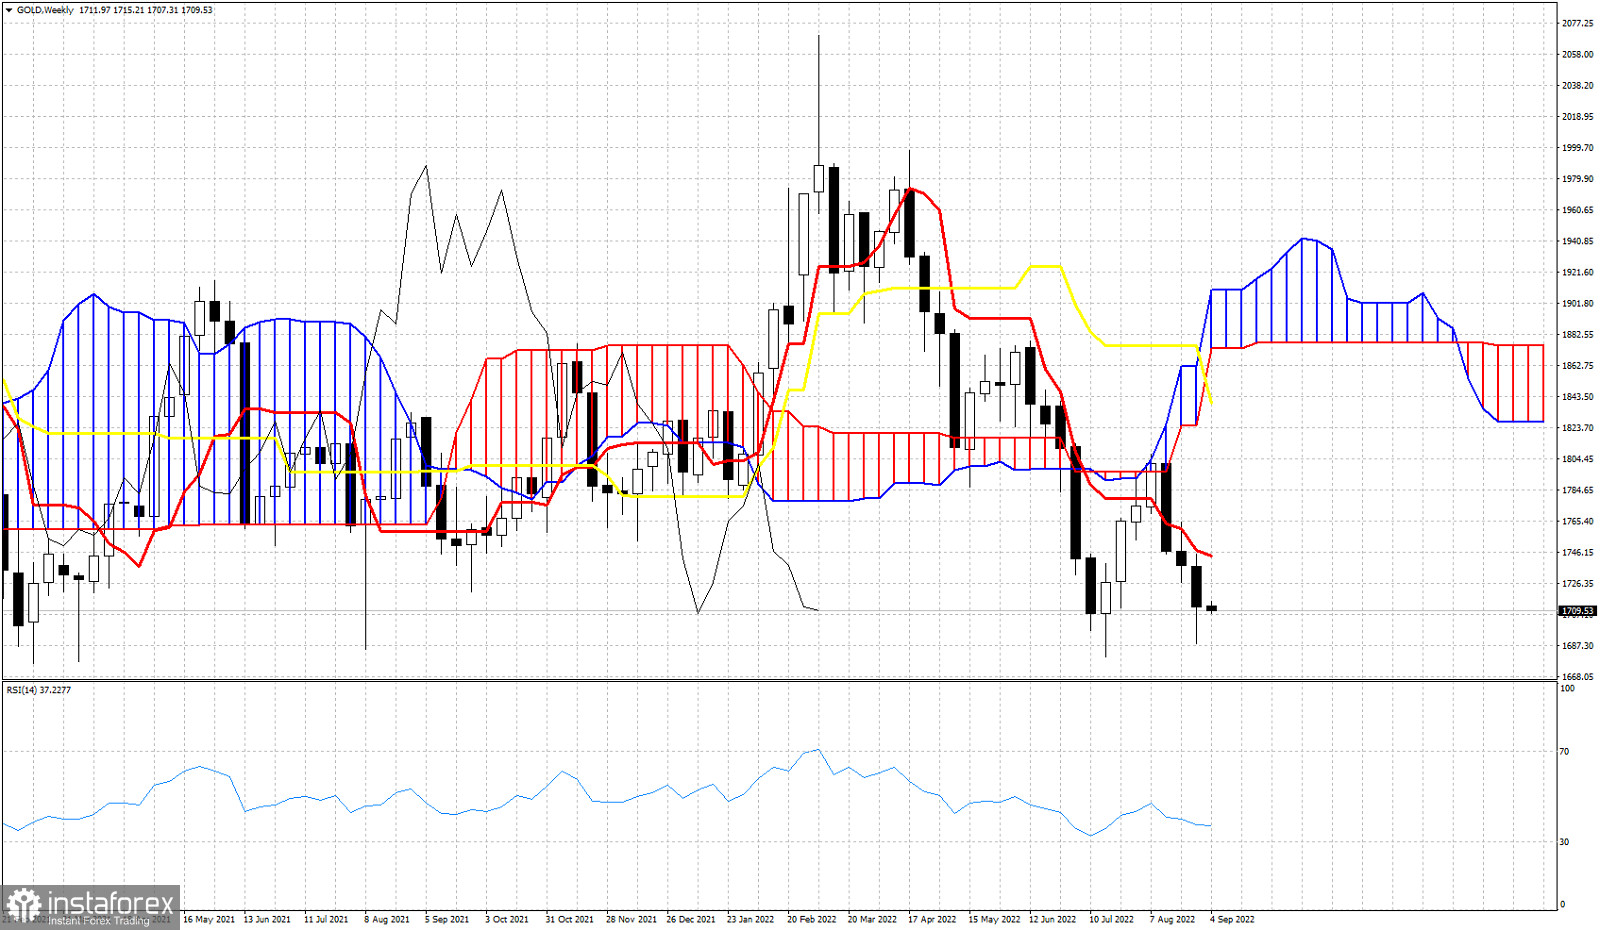
Gold price is trading just above $1,700. The Ichimoku cloud indicator in the weekly chart suggests that bears are in control. Price is below the Kumo (cloud) and price is also below both the tenkan-sen (red line indicator) and the kijun-sen (yellow line indicator). Price three weeks ago bounced towards the Kumo and got rejected. Price is again below the tenkan-sen which is another sign of vulnerability. The tenkan-sen resistance is at $1,743. Bulls must first see a close above $1,743 in order to have higher hopes. Until then, as long as price is below $1,745 Gold will be vulnerable.
 English
 Русский
 Bahasa Indonesia
 Bahasa Malay
 ไทย
ไทย Español
 Deutsch
 Български
 Français
 Tiếng Việt
 中文
中文 বাংলা
বাংলা हिन्दी
 Čeština
 Українська
 Română

