Analysis of previous deals:
30M chart of the EUR/USD pair

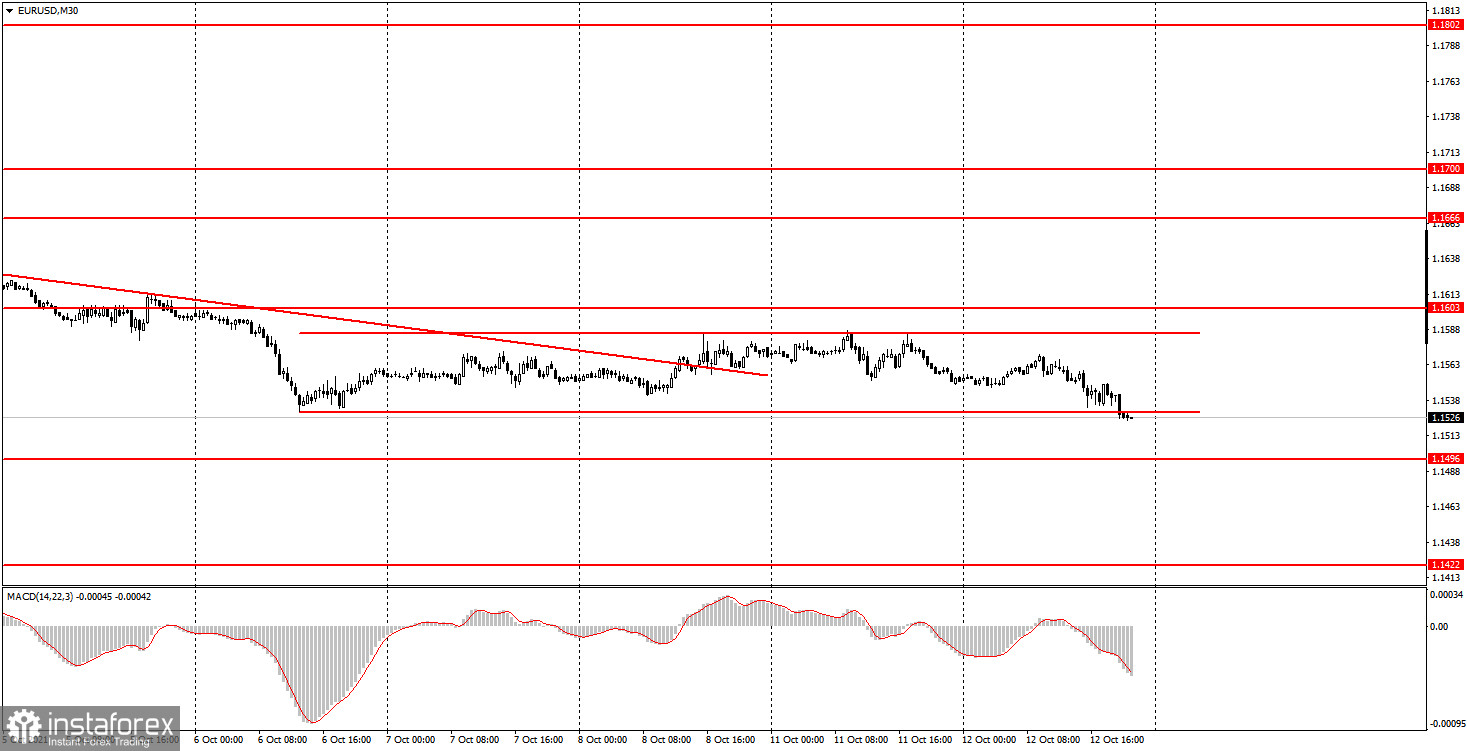
The EUR/USD pair continued to trade in absolute flat on Tuesday. This is perfectly visible on a 30-minute timeframe. However, to make it even clearer for novice traders, we have added a channel to the chart, which is built on the last five days. The channel is almost perfectly lateral. Its width is 53 points. That is, we can say that the volatility of the last five trading days is about 53 points. Thus, you do not need to be an analytic guru to conclude that it is not advisable to trade a pair. At least on the current timeframe. However, in all our recent reviews, we regularly noted that it is better not to consider the signals from the MACD indicator now. There is no trend, volatility is low. European Central Bank President Christine Lagarde also delivered a speech today, although yesterday she was not on the calendar of events. However, Lagarde again did not tell the markets anything important and interesting, which is clearly seen from the reaction of the market itself - a tick in the chart below. Thus, the boring Monday was followed by an equally dull Tuesday.
5M chart of the EUR/USD pair

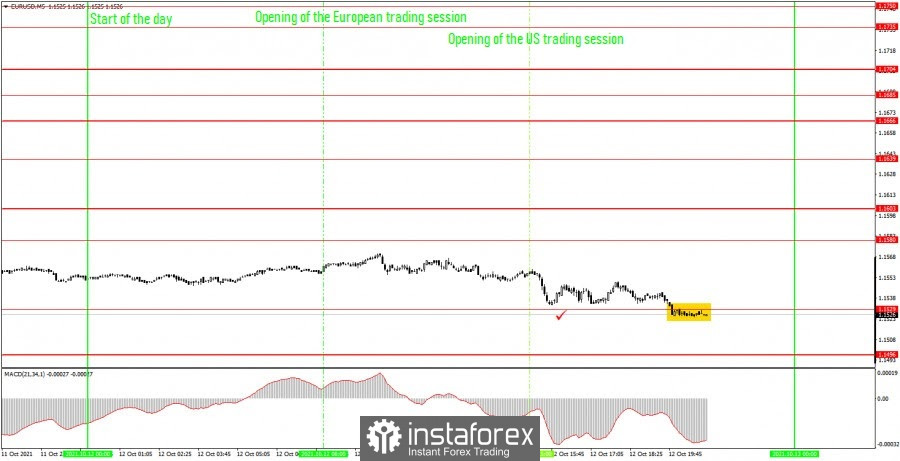
The technical picture looks even more eloquent on the 5-minute timeframe. The euro/dollar pair started the European session at 1.1556. The closest level from above was 1.1580 (24 points distance), and from the low - 1.1529 (distance 27 points). The price could not reach any of them for the whole day. Thus, not a single trading signal was generated during the day. Therefore, trades should not have been opened. Sideways movement is visible at the 5-minute TF.
How to trade on Wednesday:
The downward trend was canceled on the 30-minute timeframe, and a flat was formed instead. In most cases, volatility still does not exceed 40-50 points. Thus, it is still very inconvenient to trade on the 30-minute TF, and we still do not recommend tracking signals from the MACD indicator. The key levels on the 5-minute timeframe for October 13 are 1.1496, 1.1529, 1.1580, 1.1603, 1.1639. Take Profit, as before, is set at a distance of 30-40 points. Stop Loss - to breakeven when the price passes in the right direction by 15 points. At the 5M TF, the target can be the nearest level if it is not too close or too far away. If it is located - then you should act according to the situation or work according to Take Profit. On Wednesday, we recommend that novice traders pay attention to the US inflation report, which can provoke a movement in the market. The Federal Reserve minutes can theoretically also, but it will be published late in the evening, when the newcomers will have to close all deals and leave the market.
Analysis of previous deals:
30M chart of the GBP/USD pair

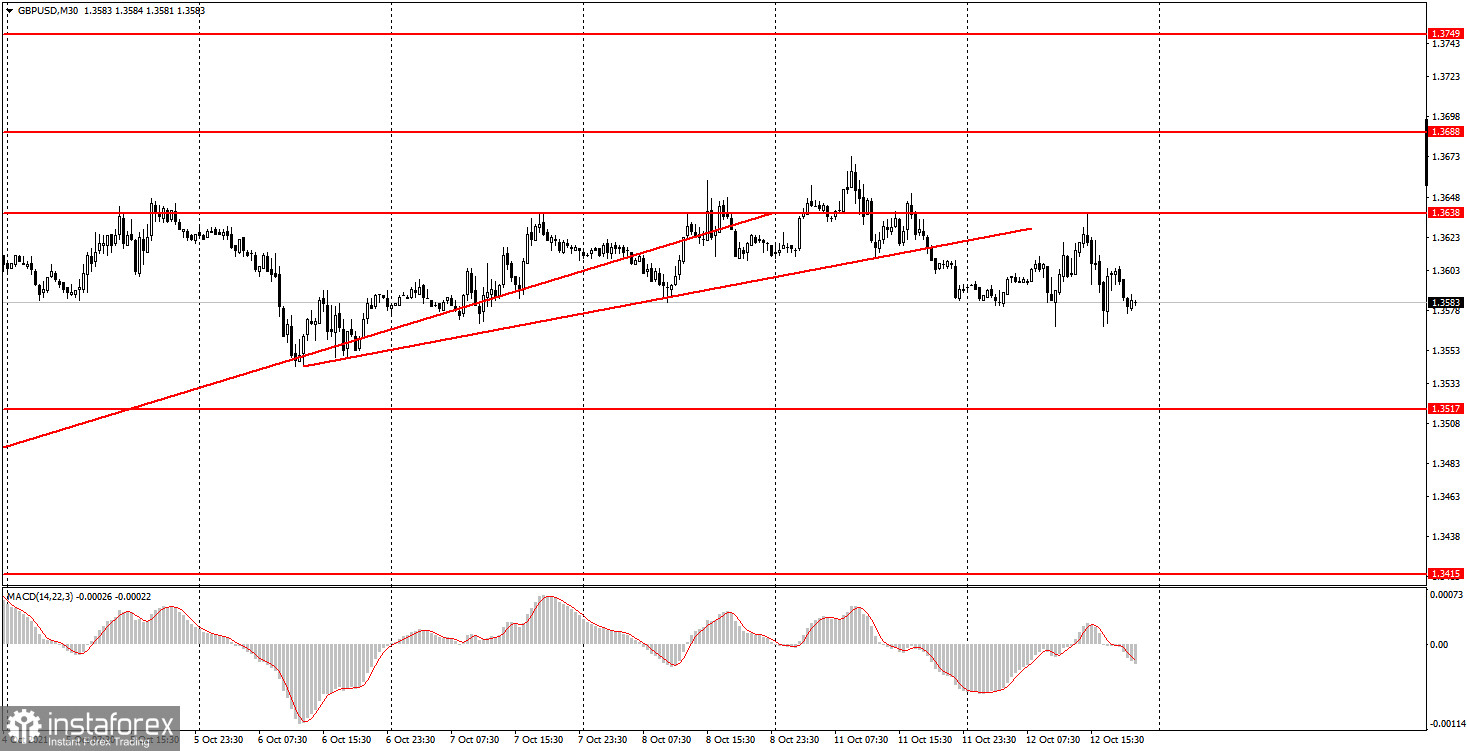
The GBP/USD pair moved in a versatile manner on the 30-minute timeframe on Tuesday, and also without a clear trend. Recall that just yesterday we formed a new trend line, warning that its price can be just as easily overcome as the previous one. And so it happened the very next day. The pound/dollar pair did not manage to clearly settle above the level of 1.3638 and stay there for a long time. The entire movement of the last few days looks more like not even a flat, but a "fence" with "fir-trees". These are movements when the direction of movement is constantly changing, and the price is in a limited sideways range, but not a clear horizontal channel. However, this type of movement is no better than a regular flat, since it also prevents the pair from trading profitably. Thus, there is no trend on the 30-minute timeframe, and it is not recommended to track signals from the MACD indicator.
5M chart of the GBP/USD pair

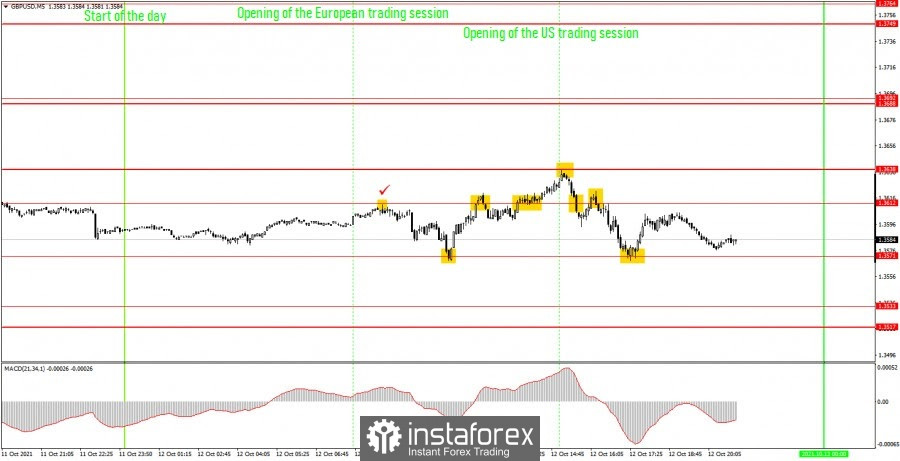
The picture is better and more complex on the 5 minute timeframe. A huge number of trading signals have been generated during the day. Most of them are even quite strong and accurate. But let's start with the fact that the UK published reports on unemployment and wages in the morning, which did not cause an adequate reaction from the markets. The values of the reports turned out to be higher than forecasted, but at the same time the pound began to fall. The first sell signal - in the form of a rebound from the level of 1.3612 - was with an error of 1 point, but it was formed just at the time when the British reports were released. Although 15 minutes after that it was clear that no reaction would follow, so the signal could be worked out with a short position. The downward movement ended near the level of 1.3571, from which a rebound followed - a buy signal. The profit on the first trade is 25 points. A long position should have been closed near the same level of 1.3612, so there was a rebound from it, and a new short position had to be opened immediately. Profit - another 23 points. But the third sell signal turned out to be false, and the price almost immediately resumed its upward movement, breaking the level of 1.3612. Close short again and enter a long position. Loss of 18 points. A rebound followed from the level of 1.3638: we close long positions and open new short positions. Profit 9 points. It overcame the 1.3612 level, and then the price was not very accurate, but nevertheless bounced off it, so the short position should have been kept open until the very development of the level 1.3571, from which a very clear rebound followed again. Here it was necessary to close short positions and open new long positions. Profit - another 44 points. The last long position should have been closed manually in the late afternoon at a profit of about 5 points. Thus, in total, novice traders at our levels could earn about 88 points today. Excellent result.
How to trade on Wednesday:
There is no clear trend at this time on the 30-minute timeframe. The upward movement seems to be preserved, but at the same time the bulls continue to stamp around the level of 1.3638. Thus, we still do not recommend considering signals from the MACD indicator. The important levels on the 5-minute timeframe are 1.3517, 1.3533, 1.3571, 1.3612, 1.3638, 1.3688. We recommend trading on them on Wednesday. The price can bounce off them or overcome them. As before, we set Take Profit at a distance of 40-50 points. At the 5M TF, you can use all the nearest levels as targets, but then you need to take profit, taking into account the strength of the movement. When passing 20 points in the right direction, we recommend setting Stop Loss to breakeven. The UK will publish data on industrial production and GDP on Wednesday. And in the US - the inflation report and the Fed minutes will be published. Thus, tomorrow can be quite an active day in terms of the pair's movement.
On the chart:
Support and Resistance Levels are the Levels that serve as targets when buying or selling the pair. You can place Take Profit near these levels.
Red lines are the channels or trend lines that display the current trend and show in which direction it is better to trade now.
The MACD indicator consists of a histogram and a signal line. When they cross, this is a signal to enter the market. It is recommended to use this indicator in combination with trend lines (channels and trend lines).
Important speeches and reports (always contained in the news calendar) can greatly influence the movement of a currency pair. Therefore, during their exit, it is recommended to trade as carefully as possible or exit the market in order to avoid a sharp price reversal against the previous movement.
Beginners on Forex should remember that not every single trade has to be profitable. The development of a clear strategy and money management are the key to success in trading over a long period of time.
 English
 Русский
 Bahasa Indonesia
 Bahasa Malay
 ไทย
ไทย Español
 Deutsch
 Български
 Français
 Tiếng Việt
 中文
中文 বাংলা
বাংলা हिन्दी
 Čeština
 Українська
 Română

