Bitcoin price prediction :
Bitcoin (BTC) is down -6.12% to €12,05 in the last 48 hours. BTC dropped below the $20,432 level for the first time since two years.
Remember that Cryptocurrencies are the new money! so, Bitcoin is really a great fortune. Hence, our target $ 29k in the next few weeks.
Today, BTC/USD is trading below the weekly pivot point $ 20k. Because BTC/USD broke support which turned to a minor resistance at the price of $ 20k.
The price of $ 21k is expected to act as major resistance in the first week of September 2022. As long as there is no daily close below $ 20k, there are no chances of a fresh increase below $ 21k (R1) in the H1 time frame.
Bitcoin stayed below the psychological level of $20,432 over the weekend, indicating a lack of urgency to accumulate at the current levels. The bears are attempting to extend BTC's decline below $20,432 in the week beginning of this week.
Following the price of $20,432 rejection, the seller takers still have the upper hand in the market, as they were able to impose more correction on BTC from the price of $20,432.
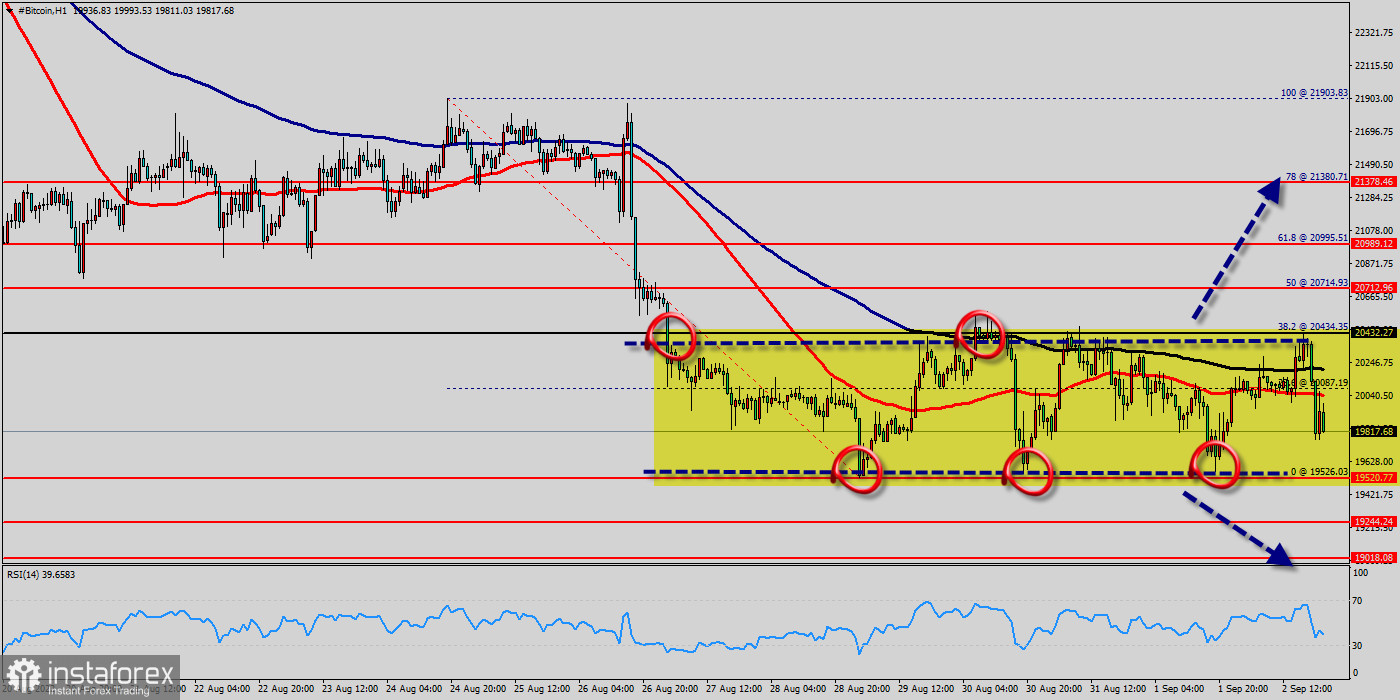
The price has been set below the strong resistance at the level of $20,432, which coincides with the 38.2% Fibonacci retracement level. This resistance has been rejected three times confirming the veracity of a downtrend.
The support levels will be placed at the prices of $19,520 and $19,244. As long as there is no daily close below $ 20k, there are chances of breaking the bottom of $19,520.
The volatility is very high for that the BTC/USD is still moving between $20,432 and $19,244 in coming hours. Consequently, the market is likely to show signs of a bearish trend again.
As a result, the market is likely to show signs of a bearish trend again. Hence, it will be good to sell below the level of $20,432 with the first target at $19,520 and further to $19,244 in order to test the weekly last bearish wave.
However, if the BTC/USD is able to break out the daily resistance at $20,712, the market will climb further to $21,903 to approach resistance 2 in coming hours.
Conclusion :
Downtrend scenario :
On the downside, the $20,432 level represents resistance. The next major resistance is located near the $20,712, which the price may drift below towards the $19,520 support region. Further close below the low end may cause a rally towards $19,244. Nonetheless, the weekly support level and zone should be considered.
Forecast :
According to the previous events the price is expected to remain between $20,432 and $19,244 levels. Sell-deals are recommended below $20,432 with the first target seen at $19,520 The movement is likely to resume to the point $ $19,244 and further to the point $19k. Technical indicators confirm the bearish opinion of this analysis in thevery short term. However, be careful of excessive bearish movements. It is appropriate to continue watching any excessive bearish movements or scanner detections which might lead to a small bullish correction.
 English
 Русский
 Bahasa Indonesia
 Bahasa Malay
 ไทย
ไทย Español
 Deutsch
 Български
 Français
 Tiếng Việt
 中文
中文 বাংলা
বাংলা हिन्दी
 Čeština
 Українська
 Română

