To open long positions on EUR/USD, you need:
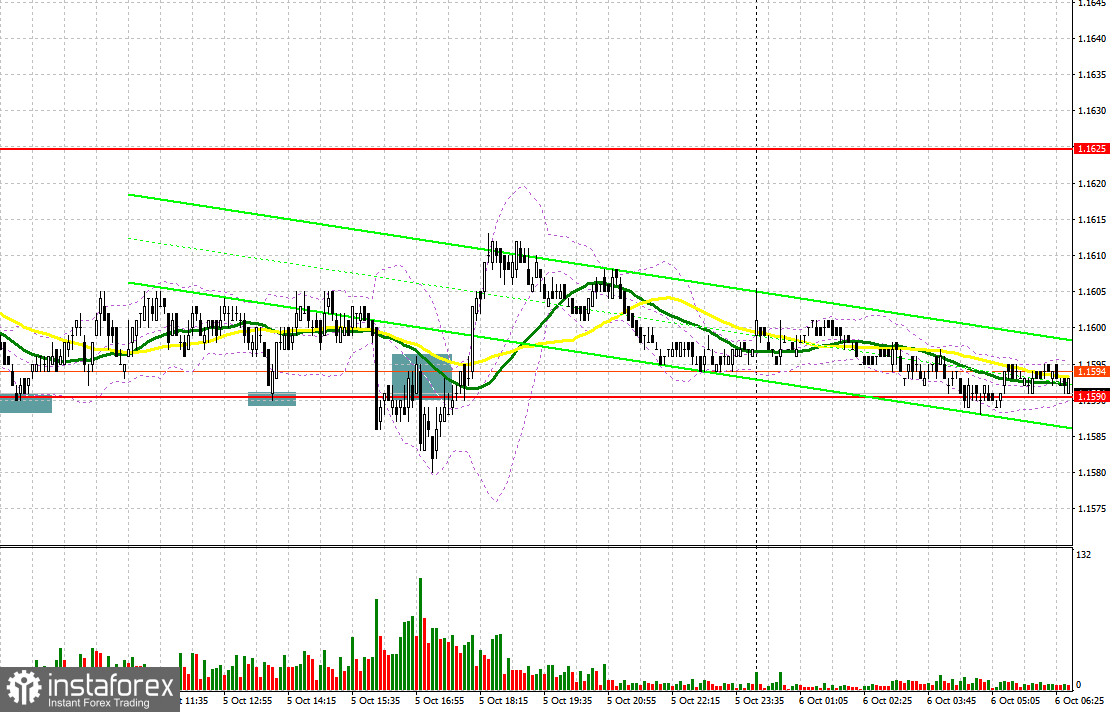
Yesterday's attempts by bulls to regain control of the market failed again. Let's take a look at the 5-minute chart and understand the entry points to the market. Even in the first half of the day, weak data on activity in the services sector of the eurozone countries, which was declining for the second consecutive month, did not allow euro bulls to seize the initiative. However, there were no people who were particularly willing to sell EUR/USD further. The test of the 1.1590 level in the first half of the day resulted in forming a false breakout and a signal to open long positions, however, the euro did not sharply rise. The pair went up about 12 points and that was it. A similar entry point was formed at the beginning of the US session, but there, too, the growth was about 12 points. An attempt by the bears to break below 1.1590 by the middle of US session followed by a test of this level from the other side resulted in forming a signal to sell the euro, but it did not bring the desired result, and trading quickly returned above the 1.1590 range.
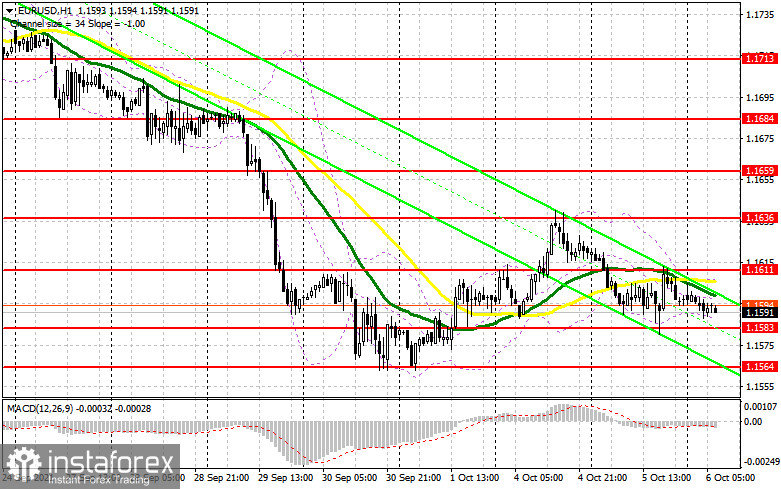
A number of data on the euro zone will be released in the morning, which is unlikely to significantly affect the euro's direction, even if the indicators turn out to be better than economists' forecasts. The report on the volume of retail sales in the eurozone in August this year does not really worry traders, when it is almost mid-October. The data on the volume of orders in the German industry may even lead to a return of pressure on the euro, as a decline is expected. An important task in today's European session will be to protect the support at 1.1583, which was formed at the end of yesterday and which is in the middle of the horizontal channel. A strong upward correction can continue from this level today, so I advise you to pay special attention to it. Only a false breakout there will lead to a signal to open long positions in hopes that EUR/USD would rise to the resistance area of 1.1611, the breakthrough of which, along with good data for the eurozone, form a convenient entry point into long positions in order to restore the pair to a high like 1.1636. The next target will be the area of 1.1659, where I recommend taking profits. If the bulls are not active at 1.1583, I advise you to postpone long positions to the weekly low of 1.1564. Opening long positions immediately on a rebound is possible only in the area of supports at 1.1538 and 1.1510, counting on an upward correction of 15-20 points within the day.

To open short positions on EUR/USD, you need:
Bears continue to control the market and are clearly aiming to return to last week's lows. A very important task is to protect the upper border of the horizontal channel at 1.1611, on which the further upward correction of the pair depends. Serious reasons for building up long positions on the dollar may appear only in the afternoon, so it is possible that the bulls will try to break above 1.1611. Only a false breakout there in the first half of the day will return the pressure to the pair, which will push it to the middle of the 1.1583 horizontal channel, which needs to be returned very quickly - unless, of course, we expect the euro to fall further. Only a breakthrough of the 1.1583 level with its reverse test from the bottom up will form a new entry point for short positions with the goal of pulling down EUR/USD to the 1.1564 area. A test of this level amid weak eurozone data would indicate a renewed bear market as bears are unlikely to release monthly lows so easily. A breakthrough of 1.1564 with a similar test from the bottom up will push EUR/USD even lower - to the 1.1538 area. The next target will be the 1.1510 low, where I recommend taking profits. If the bears are not active at 1.1611, it is best to postpone selling until the test of the larger resistance at 1.1636, or open short positions immediately on a rebound, counting on a downward correction of 15-20 points from the new high of 1.1659.

The Commitment of Traders (COT) report for September 28 revealed a sharp growth in both short and long positions, but there were more of the former, which led to a reduction in the net position. The fact that the United States of America is now going through hard political times has kept the demand for the US dollar all last week and put pressure on risky assets. The prospect of changes in the Federal Reserve's monetary policy as early as November of this year also allowed traders to build long dollar positions without much difficulty, as many investors expect the central bank to begin cutting bond buying programs towards the end of this year. An important report on US nonfarm payrolls is due this week, shedding light on how the central bank moves forward, as a lot now depends on labor market performance. The demand for risky assets will remain limited due to the high likelihood of another wave of the spread of the coronavirus, and its new strain Delta. Last week, the European Central Bank President Christine Lagarde talked a lot about how it will continue to take a wait-and-see attitude and keep the stimulus policy at current levels. However, the observed surge in inflationary pressure in the fourth quarter of this year may spoil the plans of the central bank. The COT report indicated that long non-commercial positions rose from 189,406 to 195,043, while short non-commercial positions jumped quite seriously - from 177,311 to 194,171. At the end of the week, the total non-commercial net position dropped from the level 12 095 to the level of 872. The weekly closing price also dropped to 1.1695 from 1.1726.
Indicator signals:
Moving averages
Trading is under the 30 and 50 moving averages, which indicates an attempt by the bears to retrace the September downward trend.
Note: The period and prices of moving averages are considered by the author on the H1 hourly chart and differs from the general definition of the classic daily moving averages on the daily D1 chart.
Bollinger Bands
A breakthrough of the upper border of the indicator in the area of 1.1610 will lead to a new wave of euro growth. Surpassing the lower border in the area of 1.1583 will increase the pressure on the pair.
Description of indicators
- Moving average (moving average, determines the current trend by smoothing out volatility and noise). Period 50. It is marked in yellow on the chart.
- Moving average (moving average, determines the current trend by smoothing out volatility and noise). Period 30. It is marked in green on the chart.
- MACD indicator (Moving Average Convergence/Divergence — convergence/divergence of moving averages) Quick EMA period 12. Slow EMA period to 26. SMA period 9
- Bollinger Bands (Bollinger Bands). Period 20
- Non-commercial speculative traders, such as individual traders, hedge funds, and large institutions that use the futures market for speculative purposes and meet certain requirements.
- Long non-commercial positions represent the total long open position of non-commercial traders.
- Short non-commercial positions represent the total short open position of non-commercial traders.
- Total non-commercial net position is the difference between short and long positions of non-commercial traders.
 English
 Русский
 Bahasa Indonesia
 Bahasa Malay
 ไทย
ไทย Español
 Deutsch
 Български
 Français
 Tiếng Việt
 中文
中文 বাংলা
বাংলা हिन्दी
 Čeština
 Українська
 Română

